
Synchronization of Transmembrane Na+ And K+ Traffic in the Epidermis is Evidence of the Criticality of Na+/K+-ATPase Function
Abstract
Hair spectrometry results for sodium and potassium content in healthy individuals (n = 9991) were analyzed using mathematical statistics. It was found that the vast majority (81.6%) of the overall group had a (Na)/(K) ratio > 1, with a median (Me) of 2.35. However, 18.4% had a ratio < 1 (Me = 0.68).
The median (Na)/(K) for the overall group was 1.98. Of particular interest was the analysis of the distribution of (Na) and (K) depending on the (Na)/(K) ratio. The results of this analysis are presented in the article.
Article Information
- Received
- Accepted
- Published
Academic Editor: Anubha Bajaj, Consultant Histopathologist, A.B. Diagnostics, Delhi, India
Checked for plagiarism: Yes
Review by: Single-blind
Copyright © 2026 V.I. Petukhov, et al.
 This is an open-access article distributed under the terms of the Creative Commons Attribution License, which permits unrestricted use, distribution, and reproduction in any medium, provided the original author and source are credited.
Corresponding author: V.I. Petukhov, Vladimir A.G. and N.G, Stoletovs, State University, Vladimir, Russia —
Competing Interests
The authors have declared that no competing interests exist.
Funding
No specific funding statement was provided by the authors.
Data Availability
No data-availability statement was provided by the authors.
Acknowledgements
The authors are grateful to the staff of the Center for Biotic Medicine (Moscow), and first of all to A.R. Grabeklis, for kindly providing hair mass spectrometry database for Na, K, Ca and other metals.
Citation:
Introduction
The synchronization (criticality) of oscillatory systems in living cells is apparently much more widespread than we are willing to even hypothetically imagine. ATP-dependent Na+/K+-ATPase, the main transporter of Na+ and K+ ions across the cell membrane, being an oscillator, demonstrates synchronicity in such a biosubstrate as hair.
This can be judged not only by the straight line segments characteristic of the critical phase on the Pareto distribution graphs, but also by the high values 0.8–0.9) of the linear correlation coefficient r (Pearson) between (Na) and (K) in hair 1. With the discovery of Na+/K+-ATPase in the axonal membrane of the giant squid 2, it became known:
a) that this pump for pumping Na+ out of the cell and K+ into it operates against the electrochemical gradient of these ions, using ATP molecules as the main energy source;
b) the ratio (Na+)/ (K+) in their transmembrane traffic is a constant value and equals 3/2, which allows us to speak of the coupled (coordinated) operation (as a single unit) of membrane Na+/K+-ATPases.
At the same time, confirmation of criticality using mathematical statistics methods naturally indicates a fractal (independent of the system's scale) distribution of the numerical values of Na and K. Therefore, the changes detected in individuals will obviously be similar to those at the cellular level. This significantly simplifies the research tasks and expands the possibilities for constructing working hypotheses.
Hair spectrometry data for metal content (K, Na, Ca, etc.) obtained at the Center for Biotic Medicine (Moscow) were analyzed. The authors' analysis, using mathematical statistics methods, revealed that the homeostasis of K, Na, and Ca in this biosubstrate is related to self-organized criticality (SC) phenomena 3, 4.
Potential SC markers include:
1) a power-law relationship between Na, K, and Ca content in the epidermis (hair) and the number of individuals in certain ranges of numerical values (confirmed graphically on a double logarithmic scale), as well as the fractal nature of the distribution of spectrometric results for these metals 3;
2) the conjugate (cluster) nature of quantitative shifts in metal-ligand homeostasis (MLH) of hair against the background of oxidative/nitrosative stress 5;
3) and the already mentioned reliable linear correlation (Pearson) between the concentration values of Na and K (rK-Na = 0.8-0.9 taking into account the (Na)/(K) ratio) 1.
It was found 1 that the value (Na+) / (K+) >1 in healthy individuals aged 20-49 years occurs in only 81.6% of individuals in the total sample (n = 9991). In 18.4%, this coefficient was < 1. As it turned out, the presence of this particular group of individuals in the total sample led to a decrease in rK-Na from 0.8-0.9 to 0.61.
The aim of this work is to attempt to clarify the reason for the indicated underestimation of rK-Na, as well as to detect new SC markers on the graphs of the distribution of concentration values of Na and K in the hair of practically healthy people aged from 20 to 49 years, indicating (along with the coefficient r) the synchronous operation of membrane Na+/K+-ATPases.
Material and Methods
The study involved healthy Moscow residents aged 20 to 49 years (n=9,991). Of these, 4,999 (50.04%) were men and 4,992 (49.96%) were women.
At the Center for Biotic Medicine (Moscow), sodium (Na) and potassium (K) were measured in the subjects' hair using a NexION 300D spectrometer (Perkin Elmer Inc., Shelton, CT, USA). Hair samples for spectrometric analysis were obtained with the subjects' voluntary consent. A 2-cm-long, 0.5-cm-thick lock of hair was cut from the occipital region, directly adjacent to the scalp. To reduce potential environmental contamination, the samples were rinsed with acetone, then rinsed three times with deionized water, and then air-dried at 60°C. Further sample preparation was performed using microwave digestion.
A correlation analysis (Pearson) of the obtained spectrometric results was performed to determine the K-Na correlation coefficient r (paired correlations between the concentration values of (K) and (Na) in the substrate). The Matlab software package was used for statistical processing of the data.
Results and Discussion
A significant linear correlation between (K) and (Na), which we found in the epidermal appendage (hair), indicates a coupled (synchronous) nature of the functioning of Na+/K+-ATPases, regardless of the value of the (Na+) / (K+) coefficient. We made this conclusion on the basis of previous studies 2.
The distribution of individuals depending on the value of the (Na)/(K) ratio was as follows: (Na)/(K) <1 was detected in 1834 people, i.e. 18.4% (Group I); (Na)/(K) from 1 to 5 – in 6884 people, i.e. 68.9% (Group II); (Na)/(K) from 5 to 10 – in 893 people, i.e. 8.9%, (Group III); and (Na)/(K) >10 – in 380 people, i.e. 3.8%, (Group IV).
The correlation coefficient r (Pearson) was found between (K) and (Na) in each of these groups, which was: rK-Na = 0.86 (Group I); rK-Na = 0.87 (Group II); rK-Na = 0.98 (Group III); and rK-Na = 0.9 (Group IV). The same indicator in the overall group (n=9991) total: rK-Na = 0.61 2.
We needed to determine which of the presented fragments of the overall sample contributes more to the "underestimation" of r in the general population than the others. Group I, with a (Na)/(K) coefficient <1, was the most "suspicious" in this regard, fundamentally distinguishing it from all the others. Therefore, we decided to determine how the presence of Group I in the overall sample and in combination with other groups affects the value of r.
It was found that adding Group I (with Na/K <1) to each of the other three (separately and in various combinations) led to a significant (almost halved) decrease in the rK-Na value. It is quite likely that the presence of individuals with Na/K<1 (Group I) in the overall sample explains the "underestimation" (0.61) of rK-Na for the general population.
A high level of rK-Na (~0.9) is, in our opinion, a sign of a synchronous (critical) mode of Na+/K+-ATPase operation. At the same time, high values of this indicator in group I (rK-Na= 0.86; p<0.05) with an “inverted” Na/K-coefficient (<1), which indicated synchronous operation of Na+/K+-pumps in these individuals, turned out to be unexpected and required an answer to the question: why, despite the pronounced tightness of the K-Na relationship (0.86), the presence of group I ((Na)/(K)<1) leads to a noticeable decrease in rK-Na in the overall sample? Therefore, we think it is appropriate to present (as a hypothesis) one of the possible explanations for this fact.
It can be assumed that the decrease in the Na content with the predominance of K in the biosubstrate (hair) is caused (at least in some individuals with the lowest (Na) and highest (K) values) by significant shifts in the distribution of these metals inside and outside the cell. It cannot be ruled out that such a disproportion can be explained by a polar change in the direction of the electrochemical gradient of Na+ and K+ ions or, in other words, by a reversal of the pumping function of Na+/K+-ATPase (“pumping out” K+ ions from the cell and “pumping in” Na+ ions). Note that a similar reversal (in connection with a change in the potential and the content of sodium and calcium in the cell) occurs in the work of the sodium-calcium exchanger (NCX) 6.
The leading role of Na+ ions in creating the external primary energy "backup" for Na+/K+-ATPase, which operates against the electrochemical gradient, is generally recognized. And the multiple predominance of (Na) over (K) in the biosubstrate, based on the median of Na/K ratio (Me Na/K), seems entirely logical: in the overall group, Me Na/K = 1.98, and in groups II-IV, Me Na/K = 2.35. Meanwhile, for group I, which included individuals with (K) several times higher than (Na), Me Na/K= 0.68. A reasonable question arises: are Na+ ions capable of maintaining an external "backup" with minimal amounts of this metal in the biosubstrate, alongside a significantly higher (presumably intracellular!) potassium level?
This is why the hypothesis of a possible reversal of the Na+/K+-ATPase pump function with an inverted (Na) and (K) ratio in individuals and in a specific biosubstrate (hair) remains relevant. In this regard, the distribution of (Na) and (K) with different Na/K ratio values is of interest.
Features of the distribution of concentration values of K and Na
Previous studies considered four groups corresponding to different ranges of the Na/K ratio. The following ranges were considered: Na/K < 1, 1 ≤ Na/K < 5, 5 ≤ Na/K < 10 and 10 ≤ Na/K. The complete set of data grouped by the indicated ranges is presented in Figure 1.
Figure 1. Distribution of Na and K concentrations in patients’ hair grouped by ranges of Na/K.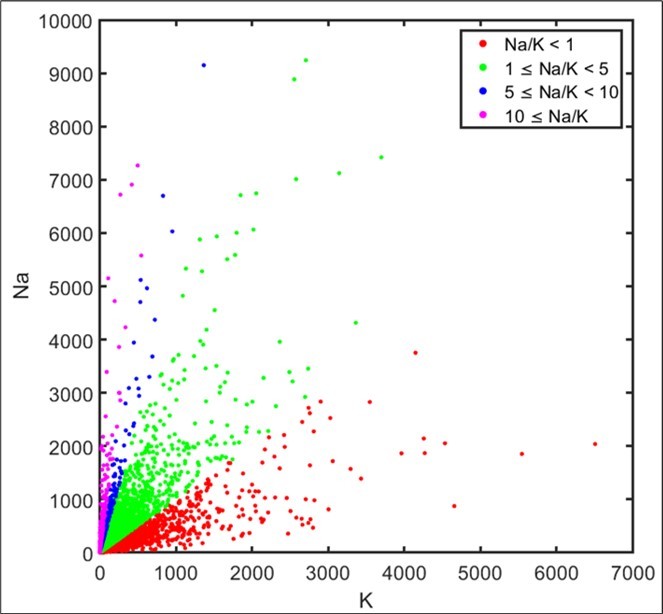
Download figure
The concentrations are distributed extremely unevenly, and the density of concentration measurements increases sharply near the origin. The medians of the Na and K distributions are 117.0 and 54.9, respectively, and the corresponding 95% percentiles are 960.9 and 682.1, respectively. Thus, concentrations greater than 1000 account for less than 5% of the total data. To estimate the density of measurements as a function of distance R from the origin, we used a normalized histogram.

which is constructed based on the frequencies vᵢ of volume n occurrence in intervals Aᵢ with Δᵢ width. In our case Δᵢ, they are identical and equal to 10. The distance R=√(Na² + K²) from the point of measurement of Na and K concentrations to the origin is used as an argument. Results in the most informative range (from 0 to 1000) are presented in Figure 2. Based on the information presented, we can see that when studying the data distribution density based on the characteristic absolute values of Na and K concentrations, it is necessary to use a dynamic range that increases with increasing concentrations. Otherwise, when using a fixed range, instead of features indicating the characteristic values of the Na/K ratio for different groups, we will see mainly statistical noise.
Figure 2. Density of measurement depending on the distance to the origin.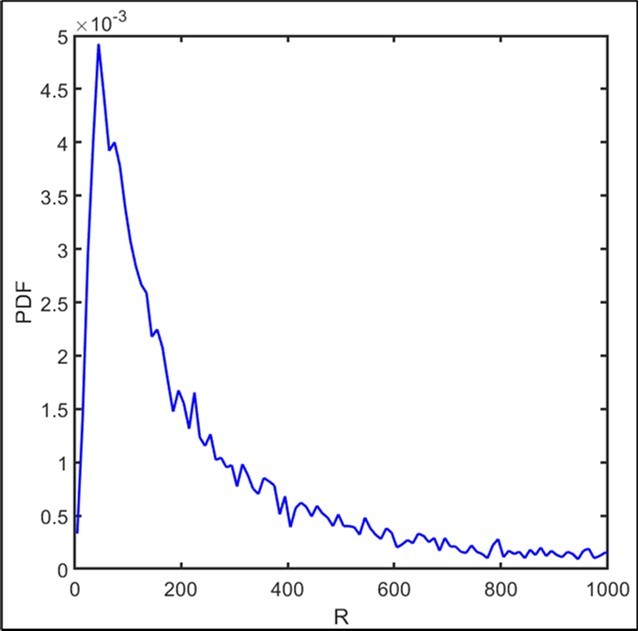
Download figure
To estimate the dependence of data density on the Na/K ratio, we used the sliding angle method. For this, we rotated the angle in 10-degree increments (100 positions) around the origin, and at each position, we calculated the number of points within that angle. Finally, the resulting data were normalized to the maximum value. The resulting angular density estimate for the entire group is shown in Figure 3. The dependence has a maximum at position 69.75 degrees, corresponding to the ratio Na/K = 2.71.
Figure 3. Angular distribution of the measurement density. The abscissa axis represents the angle between the x-axis and the bisector of the sliding angle (10 degrees). 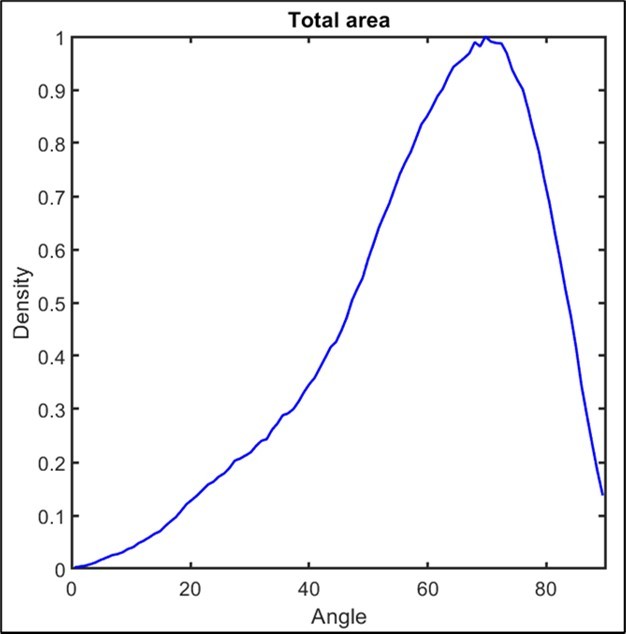
Download figure
In addition to the general group, the angular distributions of the measurement density were estimated for different concentration groups, namely, under the constraint that R belongs to a given interval:
0 ≤ R < 50, 50 ≤ R < 100, 100 ≤ R < 500 and 1000 ≤ R. The division scheme is presented in Figure 4.
Figure 4. Scheme of division into concentration ranges of Na and K. On the left is the scheme for the general group, on the right is the scheme for the most informative range of concentrations (from 0 to 1000).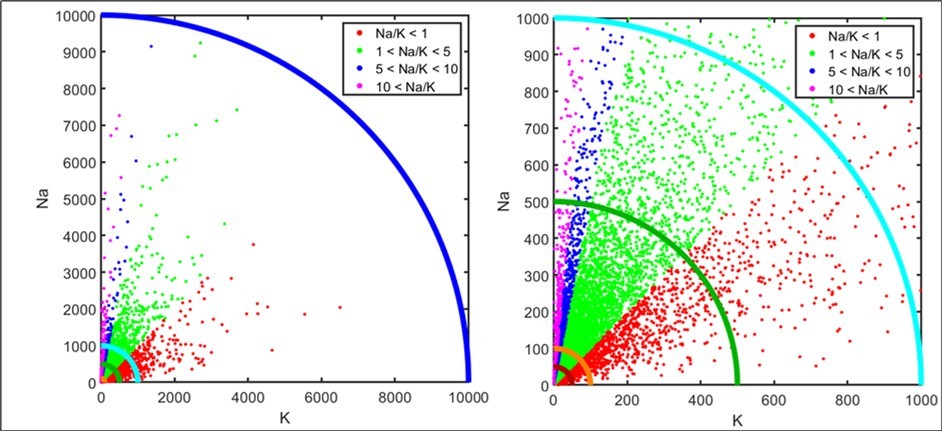
Download figure
The results of the measurement density assessment in the specified Na and K concentration ranges are presented in Figure 5. It can be seen that for concentrations up to 500, the maxima correspond to angles of 66.15-69.75 degrees (i.e. Na/K∈(2.26;2.71)), while for higher concentrations, the maxima correspond to angles of 71-75 degrees (i.e). Also, for higher concentrations, a higher data density can be noted in the range of angles less than 45 degrees, i.e. for the Na/K<1 group.
Figure 5. Angular distributions of the measurement density for different ranges of Na and K concentrations. Colors correspond to the upper limits of the ranges in Fig. 4.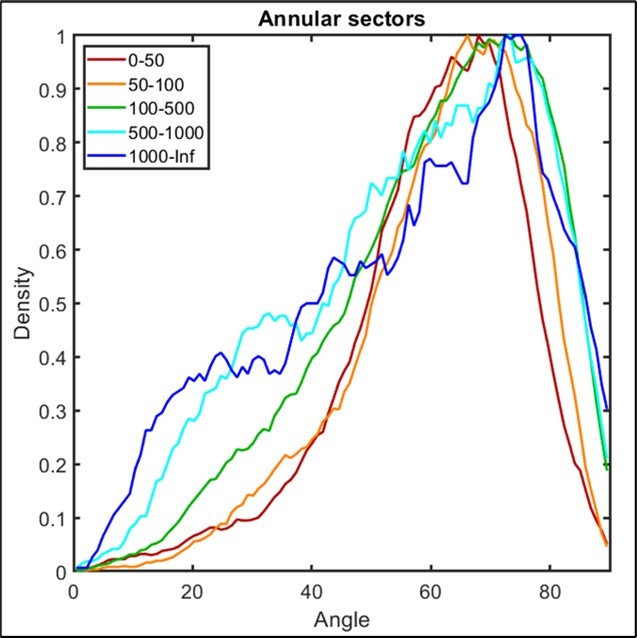
Download figure
In conclusion, we present data density estimates for various Na and K concentration ranges obtained using the K-nearest neighbor method. The method consists of the following: The measurement region is covered by a uniform grid. For each grid node, the K nearest neighbors and the distance to the most distant neighbor are determined.
The quantity considered as density is. The calculation results for different ranges are presented in Figure 6, Figure 7, Figure 8.
Figure 6. Distribution density of the total data volume using the K-nearest neighbors method.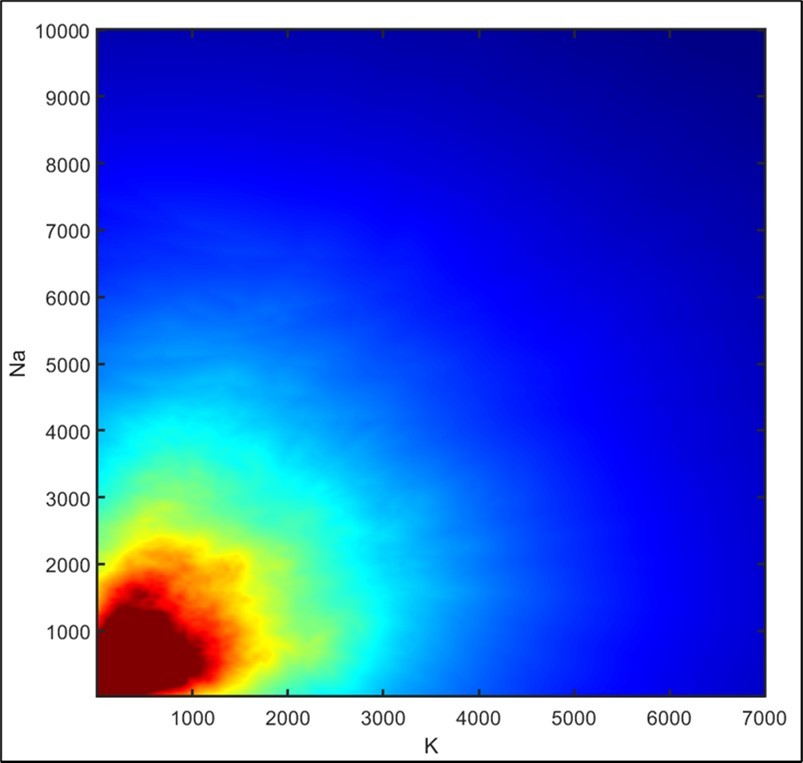
Download figure
Figure 7. Density distribution of data with concentrations from 0 to 2000 using the K-nearest neighbor method.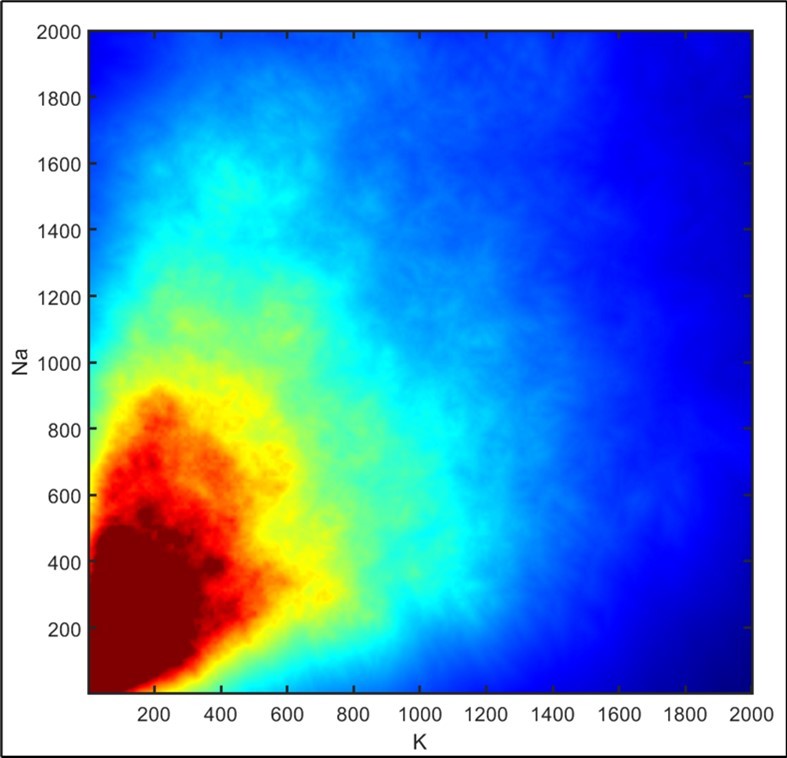
Download figure
Figure 8. Density distribution of data with concentrations from 0 to 500 using the K-nearest neighbor method.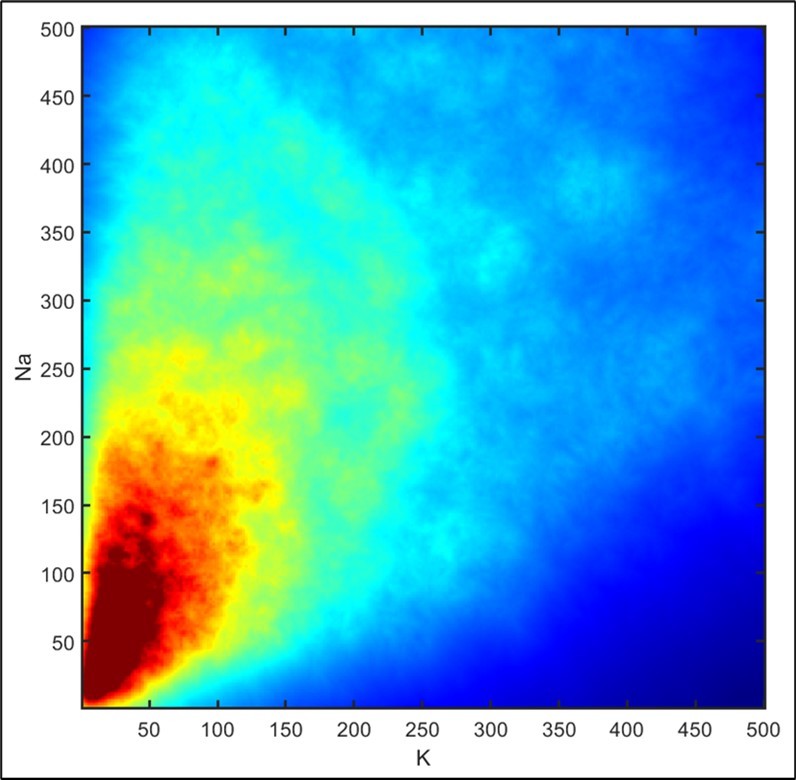
Download figure
In this case K = 30. Since ρ increases very sharply toward the origin and ρ < 1, logarithms were used to improve visualization, i.e., the value of -1/ln(ρ) is displayed instead of ρ. Red corresponds to the highest density, and blue to the lowest.
Conclusions
1) The possibility of a change in external "support" in the transmembrane transport of K and Na, when (K) in the biosubstrate significantly exceeds (Na), requires further study.
2) The obtained results once again demonstrate the inconsistency of assessing the total supply of a particular metal based on its content in hair.
References
- 1.V I Petukhov, E V Dmitriev, Baumane L Kh. (2019) Homeostasis of sodium (Na) and potassium (K) in epidermis as a self-organized criticality phenomenon. , Proteomics & Bioinformatics; 2(1), 62-7.
- 2.J C Skou. (1957) influence of some cations on an adenosine triphosphatase from peripheral nervesActa. , Biochimica et Biophysica 23, 394-401.
- 3.V I Petukhov, E V Dmitriev, Baumane L Kh, A V Skalny, Lobanova Yu N. (2016) Electrogenic metals in epidermis: relationship with cell bioenergetics. , Insights in Biomed; 1(2), 9-14.
- 4.V I Petukhov. (2017) What are the limits, if any, of normal content of electrogenic metals (K, Na, Ca) in epidermis?. , Insights in Biomed; 2(2), 13-7.