
The Possibility of Using the Fresh Water Bivalve, Spathopsis Rubens, in The Nile River, El Mahmoudia Water Stream as Bioindicator For Pollution
Abstract
Bivalves are used as bioindicators of heavy metals pollution because they are known to concentrate these elements, providing a time integrated indication of environmental contamination. Trace metals can reach high concentrations in sediments and also in aquatic organisms by bioaccumulation through the food chain. Six heavy metals (Hg, Zn, Pb, Fe, Mg and Cu) were collected and investigated from Abu Hummus, El Behara. The concentration of Hg was high in winter as 2.3µg/g in sediment. The Zn concentration was high in summer in sediment as 8.1µg/g. The Pb concentration was high in winter in water as 3.3µg/l. The concentration of Fe in sediment was high in summer as 492 µg/g. The concentration of Mg was high in sediment as 408µg/g. The concentration of Cu was high in summer in sediment as 301µg/g. The mean concentrations of Fe in the present study are within the permissible limits of law 48/1982 (<1 mg/l) and the guideline of (WHO, 1993) which is <1 mg/l. The mean concentration level of copper is within the permissible limits of law 48/1982 (<1.0 mg/l). The mean levels of the heavy metals (Hg, Zn, Pb, Fe, Mg and Cu) detected in the present study in the water stream are less than the permissible limits recommended by (USEPA, 2005). In the present study there is a significance between all seasons in the protein content in the soft tissue of Spathopsisrubensas the mean concentration level in Spring was reported as 102.83mg/g which is higher then that of autumn 100.5mg/g, summer 93.33 mg/g and winter 80.50 mg/g.
In the present study the mean activity level of GPx in spring was higher than the other seasons such as spring 31.33u/g ˃ summer 28.33 u/g ˃Autumn 26.67 u/g ˃ winter 20.50u/g. The mean activity level of SOD in summer was higher than the other seasons such as summer 38.83 u/g ˃ spring 33.33 U /g ˃Autumn 28.83U/g ˃ winter 22.83U/g. The mean activity level of CAT in spring was higher than the other seasons such as spring 25.67u/g ˃ summer and autumn19.83u/g ˃ winter 15.17u/g. The mean activity level of MDA in winter was 30.50 U/g ˃ summer 22.50U/g ˃ autumn 18.0 U/g ˃ spring 16.83U/g. In the present study it was found that the mean activity level of MDA increased in winter at the same time the mean activity level of CAT, SOD and GPx were decreased in winter. Negative correlation was reported between CAT and Hg in winter as r=-0.88*. A positive correlation coefficient in winter was found between SOD activity level and CAT activity level as r=0.838*.
Author Contributions
Academic Editor: Patricio De los RÃos, Universidad Católica de Temuco, Chile.
Checked for plagiarism: Yes
Review by: Single-blind
Copyright © 2018 E H Radwan, et al.
 This is an open-access article distributed under the terms of the Creative Commons Attribution License, which permits unrestricted use, distribution, and reproduction in any medium, provided the original author and source are credited.
Competing interests
The authors have declared that no competing interests exist.
Citation:
Introduction
The Nile River is a source of life to millions of people. Pollution caused by inadequate drainage systems in rural villages, and irrigation wastewater filled with fertilizers and pesticides. Different analytical methods were constructed to monitor the water quality status in freshwater ecosystems 1. The Nile River water is facing environmental and public health problems of water pollution which affects water quality and influences the balance of the whole ecosystem 2. The rapid progress in industry led to the release of heavy metals in the ecosystem and especially the fresh water ecosystem. The accumulation of heavy metals in the Nile River water affects the quality of the water. The iron and steel industry releases lead and zinc into the Nile River. Amer and Abdel Gawad 3 monitored the distribution of heavy metals in the Nile River water and studied the impacts of heavy metals on the water quality. Bakhiet 4 and Ayodele and Abubakar 5 suggested that the study of heavy metal contamination in bivalves is important in order to consider them as bioindicators for heavy metal contamination.The pollutants are carried from the source and tend to sink thereby polluting the aquatic environment. Although information on contaminated regions in the tropical areas are lacking, studies on pollution monitoring in fresh water lakes environment have been reported using different indicator species 6, 5. Freshwater mollusc communities are important in terms of biodiversity and ecosystem health. They play significant roles in the public and veterinary health and thus need to be scientifically more extensively 7.
A lot of researchers studied the ecology and population dynamics of the gastropods which play an important role in the health of man and his livestock 8. Ali 9 illustrated that molluscs are suitable candidates to be used in biomonitoring surveys of Lake Qarun in Egypt. Freshwater bivalves provide many ecological services to aquatic systems 10, 11. Large invertebrates can be considered metabolic reactors because they transfer nutrients and energy from water to sediments by filtering and nutrient mineralization 10, 12. The study on mollusk as a possible bioindicator of river water quality is because of the fact that they have the ability to concentrate pollutants as they are filter feeders 13. Industrial effluents contributing to aquatic pollution contain toxic substances which include heavy metals. Indiscriminate discharges of these wastes alter the quality of water and cause hazards to the fauna. Copper is a micro-nutrient and is present as a metal ion in certain enzymes and plays an important role in the transfer of electrons in electron transport chain. It is a component of haemocyanin. There is an increased body of evidence implicating heavy metals as a potential threat to aquatic organism by way of studies on their physiology, biochemistry and ecology. Marine organisms are characterized by a greater spatial ability to accumulate some metals 14. Marine organisms are characterized by a greater spatial ability to accumulate some metals when compared with bottom sediments 15. The shellfish represents an important source of protein for coastal communities. Over 90% of human health exposure to several contaminants occurs through diet primarily seafood 16, 17. In order to evaluate the adverse effect of the pollutants on aquatic organisms, there is a world wide trend to complement physical and chemical parameter with biomarkers in aquatic pollution monitoring 18, 19.
Since bivalves are filter feeders, they concentrate contaminants to a much higher level than those of the surrounding sea 20. These contaminants may cause diseases of humans, especially microbial contaminants, because shellfish are often eaten raw or lightly cooked 21, 22. To reduce the risk, the source of the shellfish should be investigated and better quality would be attained by appropriate treatment following the harvest. The effects of environmental contaminants may result from direct toxic actions on tissues or cells or from alterations of the homeostatic mechanisms including the immune system 23, 24, 25, 26, 27, 28. The protein content in the tissues of animals plays a role in the metabolism of animals 29. Heavy metals mainly react with proteins and adversely alter the physiological activities hence cause risk of life in different way. Protein acts as enzyme, hormone and basic structural component of the animal. Protein is key substance to show the effect of heavy metal. Proteins respond to stress condition for better survival by altering their levels. The shellfish represents an important source of protein for coastal communities. It has been predictable, for instance, that over 90% of human health exposure to several contaminants occurs through diet primarily seafood 15, 16, 17.
Contamination of fresh water with a wide range of pollutants has become a matter of concern over last few decades. The defence mechanisms against free radical-induced oxidative damage include the following catalytic removal of free radicals and reactive species by factors such as CAT, SOD, GPx. Animal CAT areheme-containing enzymes that convert hydrogen peroxide (H2O2) to water and O2, and they are largely localized in subcellular organelles such as peroxisomes. Mitochondria and the endoplasmic reticulum contain little CAT. The intracellular H2O2 cannot be eliminated unless it diffuses to the peroxisomes 30. GSH-Px removes H2O2 by coupling its reduction with the oxidation of GSH. GSH-Px can also reduce other peroxides. Most animal tissues contain both CAT and GSH-Px activity. SODs are metal-containing proteins that catalyze the removal of superoxide, generating water peroxide as a final product of the dismutation 31. SOD is the antioxidant enzyme that catalysed the dismutation of the highly reactive superoxide anion to O2 and to the less reactive species H2O2. Peroxide can be destroyed by CAT or GPx reactions 32. Among the biomarker of stress, the primary key events in oxidative damage are lipid peroxidation (MDA) 33, 34, 35, 36.
Aim of the work: Spathopsis rubens had been choosen as example of bivalve which lives in El Behara governerate fresh water, to study the levels of heavy metals such as Zn, Cu, Pb, Mg, Fe and Hg in water, sediment and flesh of Spathopsis rubens collected from El Mahmodia stream, River Nile. The aim of the present study is to establish its suitability as bio-indicator that could be used to monitor heavy metals pollution in Nile River and to determine CAT, SOD, GPx and the potential of lipid peroxidation. To know the effect of pollutants on Biochemicals (protein, lipid and Carbohydrates) in Spathopsis rubens.
Material and Methods
In December 2016 to July 2017 the selected bivales were collected from Abu Hummus, River Nile, El Beheira Egypt (Figure 1). The shell sizes of the detected samples were ranging from (10–15 cm) in length, from (6–9 cm) in width and from (2.6 to 4.5 cm) in height. The sediment and water samples were collected in corresponding to the clam settlements to determine the initial level of heavy metals.
Figure 1.The map of Abu Hummus, ElBehara (Google map).
Samples of Spathopsis rubens were collected from Abu Hummus El Beheira, Egypt. Abu hummus lies between the Cairo-Alexandria Agricultural road and the El Mahmodea stream at; 31.10063oN-30.310063oE. The water samples, sediment and flesh of Spathopsis rubens were collected from the river water side. Water samples were collected in plastic bottles, pre-rinsed with distilled water. The bivalves were chosen by harvesting only large but with similar sizes and healthy. A total of 15, 16, 17, 18, 19, 20 samples were collected/location/season then were kept in plastic containers filled with water.
The biochemical analysis includes the determination of metal analysis, organic pollutants, protein, lipids, carbohydrates and antioxidant enzymes (CAT, SOD, GPx and MDA). The analysis of heavy metals (Cu, Fe, Mg, Zn, Pb and Hg) of fresh water was done according to Ayodele and Abubakar 5. The heavy metals in sediment and in soft tissues were measured according to 37. The results are presented as mean ± S.D. values. One-way analysis of variance (ANOVA) was used to test the significance of depuration in each metal concentration and TPHs. Post hoc test was used to analyse the multiple comparisons among water, sediment and soft parts. All statistical analyses were performed using the SPSS 15.0 software 38. Determination of carbohydrate and lipids were according to 39. Determination of protein was estimated by Lowry’s method 40. Determination of Catalase activity (CAT) was measured according to Aebigh 41. Superoxide dismutase (SOD, EC 1.15.1.1) activity was measured using the procedure of Beauchamp and Fridovich 42, 43. Glutathione peroxidase activity levels were determined by the method of Pagtia and Valentine 44. Lipid peroxidation (Malondialdehyde) was determined by the method of OhKawa 45.
Results
Bivalve samples were collected from their natural beds from Abu Hummus, El Behirea, Egypt.The survey in the present study was reported as the following: Spathopsis wahlbergi hartmanni (Martens, 1866), Spathopsis rubens arcuata (Cailliaud, 1823), Lanistes carinates (Olivier, 1804) and Melanoides tuberculata (Müller, 1774), Melanoides tuberculata (Müller, 1774), Lanistes carinates (Olivier, 1804), Mutela singularis (Pallary, 1924). The Spathopsis rubens had been choosen (Figure 2) in the present study.
Figure 2.Spathopsis rubens
Results
Bivalve samples were collected from their natural beds from Abu Hummus, El Behirea, Egypt.The survey in the present study was reported as the following: Spathopsis wahlbergi hartmanni (Martens, 1866), Spathopsis rubens arcuata (Cailliaud, 1823), Caelatura (Horusia) parreyssi (Philippi, 1847), Lanistes carinates (Olivier, 1804) and Melanoides tuberculata (Müller, 1774), Melanoides tuberculata (Müller, 1774), Lanistes carinates (Olivier, 1804), Mutela singularis (Pallary, 1924), Caelatura (Caelatura) prasidens (Cailliaud, 1827). The Spathopsis rubens had been choosen (Figure 2) in the present study. (Table 1, Table 2, Table 3, Table 4)
Table 1. The mean concentration levels of heavy metals in water, sediment and bivalve tissue collected in autumn (2016-2017)| Heavy metals | Water (no 1), µg/L | Sediment µg/g(no 1) | Tissue (µg/g) Mean (no 6) |
| Hg | 1.1 | 2.1 | 0.93 |
| Zn | 3.1 | 4.2 | 2.08 |
| Pb | 2.7 | 2.2 | 1.73 |
| Fe | 300 | 417 | 299.7 |
| Mg | 2.44 | 3.7 | 2.61 |
| Cu | 1.95 | 2.2 | 1.35 |
| Heavy metals | Water µg/L | Sediment µg/g | Mean of tissue µg/g |
| Hg | 1.8 | 2.3 | 1.46 |
| Zn | 3.9 | 4.5 | 2.17 |
| Pb | 3.3 | 2.5 | 1.65 |
| Fe | 292 | 392 | 322 |
| Mg | 2.6 | 3.5 | 1.73 |
| Cu | 2.1 | 2 | 1.66 |
| Heavy metals | Water µg/L (no 1) | Sediment µg/g(no 1) | Average (no 6)tissue µg/g |
| Hg | 1.5 | 1.9 | 1.26 |
| Zn | 4.1 | 5.2 | 2.83 |
| Pb | 2.2 | 2.6 | 1.32 |
| Fe | 235 | 400 | 252.33 |
| Mg | 3.2 | 4.1 | 2.38 |
| Cu | 1.98 | 2.3 | 1.41 |
| Heavy metals | Water µg/L(no 1) | Sediment µg/g (No 1) | tissue µg/L(no 6) |
| Hg | 1.6 | 2.2 | 1.10 |
| Zn | 5.6 | 8.1 | 4.23 |
| Pb | 2.8 | 2.9 | 0.89 |
| Fe | 321 | 492 | 274.2 |
| Mg | 4.1 | 4.8 | 2.21 |
| Cu | 2.1 | 3.1 | 1.14 |
The mean concentration level of Hg was hiher in winter in sediment as 2.3µg/g than in water and in tissue.
The mean concentration level of Zn was higher in summer in sediment as 8.1 than in water and tissue. The mean concentration level of Pb was higher in winter in water as 3.3µg/g than in sediment and tissue. The mean concentration level of Fe was higher in summer as 492µg/g than in winter and tissue. The Mg concentrations were higher in sediment as 408µg/g than in water and tissue. The Cu concentrations were higher in summer in sediment as 301µg/g than in water and tissue. (Table 5, Table 6, Table 7, Table 8, Table 9, Table 10, Table 11)
Table 5. The mean activity level of GPx during (2016-2017).| GPx | Mean ± SD. |
| Autumn (n = 6) | 26.67 ± 6.35 |
| Winter (n = 6) | 20.50 ± 4.85 |
| Spring (n = 6) | 31.33 ± 6.35 |
| Summer (n = 6) | 28.33 ± 9.09 |
| F (p) | 2.681 (0.074) |
| SOD | Mean ± SD. |
| Autumn (n= 6) | 28.83bc ± 5.67 |
| Winter (n = 6) | 22.83c± 4.36 |
| Spring (n = 6) | 33.33ab± 7.81 |
| Summer (n = 6) | 38.83a± 8.64 |
| F (p) | 5.919* (0.005*) |
| CAT | Mean ± SD. |
| Autumn (n = 6) | 19.83 ± 5.46 |
| Winter (n = 6) | 15.17 ± 5.38 |
| Spring (n = 6) | 25.67 ± 8.80 |
| Summer (n = 6) | 19.83 ± 3.76 |
| F (p) | 2.951 (0.057) |
| MDA | Mean ± SD. |
| Autumn (n = 6) | 18.0b ± 2.83 |
| Winter (n = 6) | 30.50a± 8.26 |
| Spring (n = 6) | 16.83b± 6.94 |
| Summer (n = 6) | 22.50b± 6.28 |
| F (p) | 5.620* (0.006*) |
| Protein | Mean ± SD. |
| Autumn (n = 6) | 100.5 ± 15.04 |
| Winter (n = 6) | 80.50 ± 12.10 |
| Spring (n = 6) | 102.83 ± 18.67 |
| Summer (n = 6) | 93.33 ± 13.7 |
| F (p) | 2.657 (0.076) |
| Lipid | Mean ± SD. |
| Autumn (n = 6) | 12.78 ± 2.34 |
| Winter (n = 6) | 10.60 ± 2.90 |
| Spring (n = 6) | 10.25 ± 1.20 |
| Summer (n = 6) | 9.38 ± 1.54 |
| F (p) | 2.837 (0.064) |
| Carbohydrates | Mean ± SD. |
| Autumn (n = 6) | 12.05 ± 1.91 |
| Winter (n = 6) | 10.62 ± 2.50 |
| Spring (n = 6) | 13.40 ± 2.72 |
| Summer (n = 6) | 11.78 ± 3.63 |
| F(p) | 1.029(0.401) |
A Histogram of the mean activity level of different enzymes in the bivalve (2016-2017) (Figure 3, Figure 4, Figure 5, Figure 6)
Figure 3.The mean concentration of the activity levels of GPx (mU/mg.protein) in different seasons (2016-2017).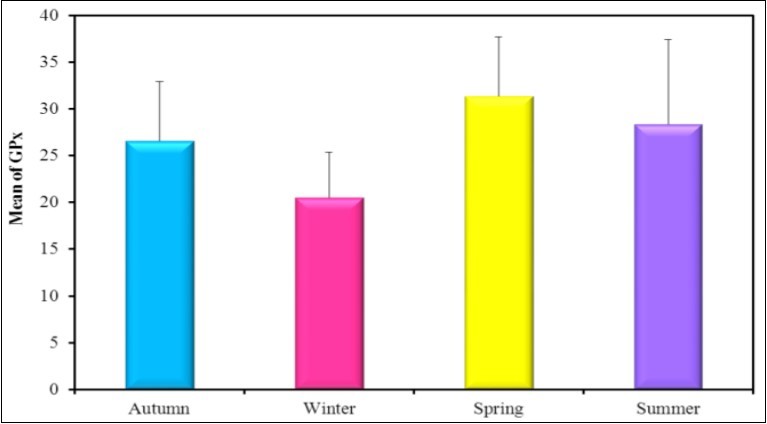
Figure 4.The mean concentration of the activity levels of SOD (U/g.tissue) in different seasons (2016-2017).
Figure 5.The mean concentration levels of activity of CAT(U/g) in different seasons during (2016-2017).
Figure 6.The mean concentration levels of activity of MDA (nmol/mg tissue) in different seasons (2016-2017).
Figure 7.The mean concentration levels of total Protein (g/dl) in different seasons during (2016-2017).
Figure 8.The mean concentration levels of lipid (mg/dl) in different seasons during (2016-2017).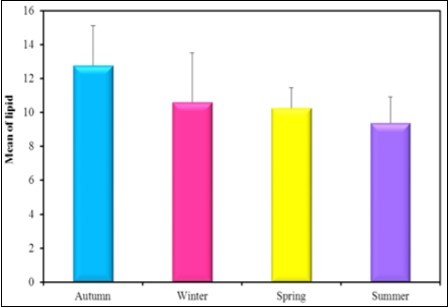
Figure 9.The mean concentration levels of carbohydrates in different seasons during (2016-2017).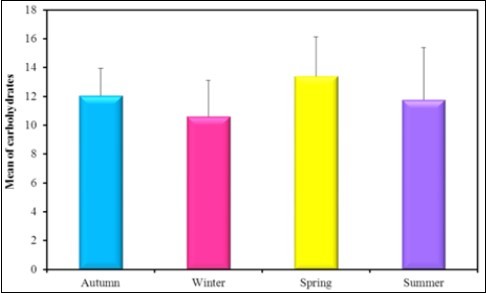
Figure 10.the mean concentration level of Hg in the different seasons during the year (2016-2017).
Figure 11.the mean concentration level of Zn in the different seasons during the year (2016-2017).
Figure 12.the mean concentration level of Pb in different seasons during the year (2016-2017).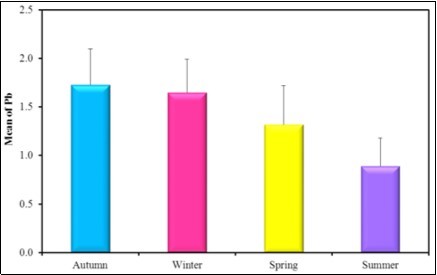
Figure 13.the mean concentration level of Fe in different seasons during the year (2016-2017).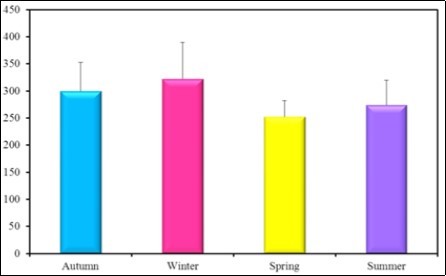
Figure 14.the mean concentration level of Mg in different seasons during the year (2016-2017).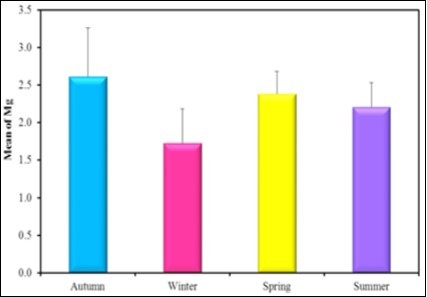
Figure 15.the mean concentration level of Cu in different seasons during the year (2016-2017).
A histogram representing the selected biochemical parameters in the bivalve (2016-2017)(Figure 7, Figure 8, Figure 9)
A histogram of the mean concentration levels of the selected heavy metals in water (µg/g) in different seasons during the year (2016-2017) (Table 12, Table 13, Table 14, Table 15, Table 16) (Figure 10, Figure 11, Figure 12, Figure 13, Figure 14, Figure 15)
Table 12. The mean concentration levels of heavy metals in the tissue (Zn, Pb, Fe, Mg, Cu and Hg) in different seasons during the year ( 2016-2017):| Zn | Mean ± S.D. | Pb | Mean ± S.D. | |
| Autumn (n = 6) | 2.08b ± 0.52 | Autumn (n = 6) | 1.73a ± 0.37 | |
| Winter (n = 6) | 2.17b± 0.63 | Winter (n = 6) | 1.65a± 0.34 | |
| Spring (n = 6) | 2.83b± 0.82 | Spring (n = 6) | 1.32a± 0.40 | |
| Summer (n = 6) | 4.23a± 0.67 | Summer (n = 6) | 0.89b± 0.29 | |
| F (p) | 13.300* (<0.001*) | F (p) | 7.032* (0.002*) | |
| Fe | Mean ± S.D. | Mg | Mean ± S.D. | |
| Autumn (n = 6) | 299.67 ± 52.82 | Autumn (n = 6) | 2.61a ± 0.65 | |
| Winter (n = 6) | 322.33 ± 67.30 | Winter (n = 6) | 1.73b± 0.45 | |
| Spring (n = 6) | 252.33 ± 29.97 | Spring (n = 6) | 2.38a± 0.30 | |
| Summer (n = 6) | 274.17 ± 45.59 | Summer (n = 6) | 2.21ab± 0.32 | |
| F (p) | 2.157 (0.12) | F(p) | 4.043* (0.021*) | |
| Cu | Mean ± SD. | Hg | Mean ± SD. | |
| Autumn (n = 6) | 1.35 ± 0.31 | Autumn (n = 6) | 0.93b ± 0.21 | |
| Winter (n = 6) | 1.66 ± 0.29 | Winter (n = 6) | 1.46a± 0.45 | |
| Spring (n = 6) | 1.41 ± 0.32 | Spring (n = 6) | 1.26ab± 0.21 | |
| Summer (n = 6) | 1.14 ± 0.34 | Summer (n = 6) | 1.10b± 0.19 | |
| F (p) | 2.7 (0.07) | F (p) | 3.756* (0.027*) |
| SOD | CAT | MDA | Protein | Lipid | Carbohydrates | Hg | Zn | Pb | Fe | Mg | Cu | ||
| GPx | r | 0.070 | -0.655 | -0.033 | 0.189 | 0.714 | 0.956* | -0.117 | -0.009 | 0.444 | 0.050 | 0.691 | 0.764 |
| p | 0.895 | 0.158 | 0.950 | 0.721 | 0.111 | 0.003 | 0.825 | 0.987 | 0.378 | 0.925 | 0.128 | 0.077 | |
| SOD | r | 0.303 | -0.873* | 0.744 | -0.544 | -0.167 | -0.998* | 0.200 | -0.639 | -0.925* | -0.534 | 0.003 | |
| p | 0.560 | 0.023 | 0.090 | 0.265 | 0.751 | <0.001 | 0.704 | 0.172 | 0.008 | 0.275 | 0.996 | ||
| CAT | r | -0.052 | 0.481 | -0.922* | -0.805 | -0.296 | -0.579 | -0.870* | -0.536 | -0.432 | -0.581 | ||
| p | 0.922 | 0.334 | 0.009 | 0.054 | 0.570 | 0.228 | 0.024 | 0.273 | 0.393 | 0.227 | |||
| MDA | r | -0.588 | 0.374 | 0.148 | 0.865* | -0.503 | 0.483 | 0.796 | 0.521 | 0.157 | |||
| p | 0.220 | 0.465 | 0.779 | 0.026 | 0.309 | 0.332 | 0.058 | 0.289 | 0.766 | ||||
| Protein | r | -0.499 | -0.106 | -0.775 | -0.364 | -0.793 | -0.908* | -0.020 | -0.189 | ||||
| p | 0.314 | 0.841 | 0.070 | 0.479 | 0.060 | 0.012 | 0.970 | 0.719 | |||||
| Lipid | r | 0.877* | 0.522 | 0.234 | 0.910* | 0.692 | 0.714 | 0.619 | |||||
| p | 0.022 | 0.289 | 0.655 | 0.012 | 0.128 | 0.111 | 0.190 | ||||||
| Carbohydrates | r | 0.128 | 0.084 | 0.685 | 0.329 | 0.724 | 0.821 | ||||||
| p | 0.809 | 0.874 | 0.133 | 0.524 | 0.104 | 0.045 | |||||||
| Hg | r | -0.161 | 0.639 | 0.932* | 0.482 | -0.028 | |||||||
| p | 0.761 | 0.172 | 0.007 | 0.333 | 0.958 | ||||||||
| Zn | r | 0.365 | 0.072 | -0.453 | 0.069 | ||||||||
| p | 0.477 | 0.892 | 0.367 | 0.897 | |||||||||
| Pb | r | 0.856* | 0.449 | 0.606 | |||||||||
| p | 0.029 | 0.371 | 0.202 | ||||||||||
| Fe | r | 0.426 | 0.262 | ||||||||||
| p | 0.400 | 0.616 | |||||||||||
| Mg | r | 0.365 | |||||||||||
| p | 0.477 | ||||||||||||
| Cu | r | ||||||||||||
| p |
| SOD | CAT | MDA | Protein | Lipid | Carbohydrates | Hg | Zn | Pb | Fe | Mg | Cu | ||
| GPx | r | 0.800 | 0.632 | -0.542 | 0.421 | 0.169 | 0.217 | -0.714 | -0.079 | 0.055 | -0.564 | 0.284 | -0.227 |
| p | 0.056 | 0.178 | 0.267 | 0.405 | 0.748 | 0.680 | 0.111 | 0.882 | 0.918 | 0.244 | 0.585 | 0.665 | |
| SOD | r | 0.838* | -0.570 | 0.290 | -0.035 | -0.404 | -0.664 | 0.202 | -0.142 | -0.108 | 0.075 | -0.605 | |
| p | 0.037 | 0.238 | 0.577 | 0.948 | 0.427 | 0.150 | 0.701 | 0.788 | 0.839 | 0.888 | 0.203 | ||
| CAT | r | -0.456 | 0.032 | 0.190 | -0.314 | -0.880* | -0.146 | 0.236 | 0.159 | -0.160 | -0.318 | ||
| p | 0.363 | 0.952 | 0.719 | 0.545 | 0.021 | 0.783 | 0.653 | 0.763 | 0.763 | 0.538 | |||
| MDA | r | -0.339 | -0.606 | 0.136 | 0.604 | -0.408 | 0.517 | 0.211 | -0.226 | 0.479 | |||
| p | 0.511 | 0.202 | 0.797 | 0.205 | 0.422 | 0.293 | 0.688 | 0.667 | 0.337 | ||||
| Protein | r | -0.286 | 0.116 | -0.027 | 0.608 | -0.017 | -0.035 | -0.393 | 0.185 | ||||
| p | 0.583 | 0.827 | 0.960 | 0.200 | 0.974 | 0.947 | 0.441 | 0.725 | |||||
| Lipid | r | 0.345 | -0.570 | -0.309 | -0.145 | -0.311 | 0.408 | -0.029 | |||||
| p | 0.503 | 0.238 | 0.552 | 0.785 | 0.548 | 0.422 | 0.956 | ||||||
| Carbohydrates | r | -0.090 | -0.550 | 0.440 | -0.614 | 0.238 | 0.705 | ||||||
| p | 0.865 | 0.258 | 0.383 | 0.195 | 0.650 | 0.118 | |||||||
| Hg | r | 0.329 | -0.258 | 0.134 | -0.046 | 0.122 | |||||||
| p | 0.525 | 0.622 | 0.801 | 0.931 | 0.818 | ||||||||
| Zn | r | -0.657 | 0.277 | -0.243 | -0.406 | ||||||||
| p | 0.156 | 0.595 | 0.643 | 0.425 | |||||||||
| Pb | r | 0.212 | -0.511 | 0.768 | |||||||||
| p | 0.687 | 0.300 | 0.074 | ||||||||||
| Fe | r | -0.835* | 0.105 | ||||||||||
| p | 0.039 | 0.844 | |||||||||||
| Mg | r | -0.474 | |||||||||||
| p | 0.343 | ||||||||||||
| Cu | r | ||||||||||||
| p |
| SOD | CAT | MDA | Protein | Lipid | Carbohydrates | Hg | Zn | Pb | Fe | Mg | Cu | ||
| GPx | r | 0.235 | 0.407 | 0.138 | -0.754 | -0.274 | -0.765 | 0.069 | -0.590 | 0.649 | 0.293 | -0.324 | 0.529 |
| P | 0.654 | 0.423 | 0.795 | 0.083 | 0.600 | 0.076 | 0.897 | 0.218 | 0.163 | 0.573 | 0.530 | 0.281 | |
| SOD | R | 0.357 | 0.709 | -0.274 | 0.248 | 0.011 | 0.090 | 0.023 | -0.288 | -0.079 | 0.165 | -0.457 | |
| P | 0.488 | 0.115 | 0.600 | 0.636 | 0.983 | 0.866 | 0.965 | 0.580 | 0.882 | 0.754 | 0.363 | ||
| CAT | R | 0.778 | -0.779 | 0.594 | 0.030 | 0.774 | -0.513 | 0.316 | 0.392 | 0.258 | 0.224 | ||
| P | 0.068 | 0.068 | 0.214 | 0.955 | 0.071 | 0.298 | 0.542 | 0.442 | 0.621 | 0.670 | |||
| MDA | R | -0.621 | 0.790 | 0.242 | 0.391 | -0.317 | 0.096 | 0.119 | 0.236 | -0.028 | |||
| P | 0.188 | 0.061 | 0.644 | 0.443 | 0.541 | 0.857 | 0.823 | 0.653 | 0.958 | ||||
| Protein | R | -0.406 | 0.431 | -0.265 | 0.700 | -0.773 | -0.434 | 0.240 | -0.652 | ||||
| P | 0.425 | 0.393 | 0.612 | 0.122 | 0.071 | 0.390 | 0.647 | 0.160 | |||||
| Lipid | R | 0.372 | 0.291 | -0.056 | 0.108 | 0.320 | 0.048 | 0.060 | |||||
| P | 0.468 | 0.576 | 0.917 | 0.838 | 0.536 | 0.929 | 0.911 | ||||||
| Carbohydrates | R | 0.316 | 0.050 | -0.523 | -0.584 | 0.804 | -0.413 | ||||||
| P | 0.541 | 0.926 | 0.287 | 0.223 | 0.054 | 0.415 | |||||||
| Hg | R | -0.243 | -0.129 | 0.208 | 0.616 | -0.130 | |||||||
| P | 0.643 | 0.808 | 0.692 | 0.192 | 0.805 | ||||||||
| Zn | R | -0.727 | 0.225 | -0.226 | -0.731 | ||||||||
| P | 0.101 | 0.668 | 0.667 | 0.099 | |||||||||
| Pb | R | 0.296 | -0.471 | 0.978* | |||||||||
| P | 0.569 | 0.346 | 0.001 | ||||||||||
| Fe | R | -0.622 | 0.201 | ||||||||||
| P | 0.187 | 0.702 | |||||||||||
| Mg | R | -0.395 | |||||||||||
| P | 0.438 | ||||||||||||
| Cu | R | ||||||||||||
| P |
| SOD | CAT | MDA | Protein | Lipid | Carbohydrates | Hg | Zn | Pb | Fe | Mg | Cu | ||
| GPx | r | -0.106 | -0.395 | -0.185 | -0.095 | 0.837* | -0.667 | 0.865* | -0.113 | -0.022 | -0.338 | 0.390 | 0.038 |
| P | 0.841 | 0.438 | 0.725 | 0.858 | 0.038 | 0.148 | 0.026 | 0.831 | 0.968 | 0.512 | 0.445 | 0.942 | |
| SOD | r | -0.309 | 0.437 | 0.693 | -0.198 | 0.544 | 0.108 | 0.637 | 0.363 | 0.574 | 0.204 | -0.371 | |
| P | 0.552 | 0.387 | 0.127 | 0.706 | 0.264 | 0.839 | 0.174 | 0.479 | 0.234 | 0.699 | 0.469 | ||
| CAT | r | 0.579 | -0.419 | -0.662 | 0.274 | -0.350 | 0.192 | -0.583 | 0.584 | -0.386 | 0.528 | ||
| P | 0.228 | 0.408 | 0.152 | 0.600 | 0.497 | 0.716 | 0.224 | 0.223 | 0.450 | 0.281 | |||
| MDA | r | 0.030 | -0.451 | 0.251 | 0.061 | 0.363 | -0.310 | 0.821* | 0.216 | 0.331 | |||
| P | 0.955 | 0.370 | 0.631 | 0.909 | 0.479 | 0.549 | 0.045 | 0.681 | 0.521 | ||||
| Protein | r | -0.239 | 0.482 | -0.267 | 0.268 | 0.893* | 0.176 | 0.367 | -0.912* | ||||
| P | 0.649 | 0.333 | 0.609 | 0.608 | 0.016 | 0.739 | 0.474 | 0.011 | |||||
| Lipid | r | -0.823* | 0.806 | -0.403 | -0.021 | -0.673 | 0.393 | 0.093 | |||||
| P | 0.044 | 0.053 | 0.428 | 0.969 | 0.143 | 0.441 | 0.861 | ||||||
| Carbohydrates | r | -0.592 | 0.752 | 0.181 | 0.697 | -0.520 | -0.294 | ||||||
| P | 0.216 | 0.085 | 0.732 | 0.124 | 0.290 | 0.572 | |||||||
| Hg | r | 0.065 | -0.316 | -0.112 | 0.296 | 0.353 | |||||||
| P | 0.902 | 0.542 | 0.833 | 0.569 | 0.492 | ||||||||
| Zn | r | -0.145 | 0.797 | -0.508 | 0.017 | ||||||||
| P | 0.785 | 0.057 | 0.304 | 0.974 | |||||||||
| Pb | r | -0.265 | 0.473 | -0.985* | |||||||||
| P | 0.612 | 0.344 | <0.001 | ||||||||||
| Iron | r | -0.255 | 0.191 | ||||||||||
| P | 0.625 | 0.717 | |||||||||||
| Mg | r | -0.339 | |||||||||||
| P | 0.511 | ||||||||||||
| Cu | r | ||||||||||||
| P |
In Autumn the activity of GPx and of MDA were positively correlated with the carbohydrate contents in the bivalve as r=0.956* an r=0.865*; respectively. The activity level of SOD is negatively correlated with MDA, Hg, Fe as r=-0.873*, r=-0.998*, r=-0.925*; respectively. The activity of CAT is negatively correlated with the lipid content, Pb as r=-0.922*, r=-0.87*; respectively.
The total protein content is negatively correlated with Fe concentration level in tissues as r=-0.908*. The lipid contents is positively correlated with the carbohydrate contents as r=0.877* and r=0.910*; respectively. Both Hg and Pb are positively correlated with Fe concentration level in tissues of the bivalve as r=0.932* and r=0.856*; respectively.
The correlation coefficient in winter was only between SOD mean activity inhibition level and CAT mean activity level as r=0.838*. Negative correlation was found between CAT and Hg as r=0.88*. The mean concentration level of Fe and Mg in tissues showed a negative correlation as r=-0.835*.
In spring only the mean concentration level of Pb and Cu in tissue showed a high significant correlation as r=0.978*.
In summer there were positive correlation between the mean activity level of GPx and lipid content and Hg in tissues as r=0.837* and r=0.865*; respectively. The mean activity level of MDA was positively correlated with the mean concentration level of Fe in tissues as r=0.821*. The mean level of the total protein content was positively correlated with Pb mean concentration level as r=0.893* and negatively correlated with Cu mean concentration level as r=-0.912*. Whereas the mean concentration level of the lipid content was negatively correlated with the mean concentration level of the carbohydrate contents as r=-0.828* and Pb in tissue was also negatively correlated with Cu in tissues as r=-0.985.
Discussion
In the present study Spathopsis rubens was collected from El Beheira, Egypt, Abu Hummus. These species was already detected in previous reports 46. In the present study the heavy metals (Hg, Zn, Pb, Fe, Cu and Mg) were detected in the four seasons from autumn (2016) to summer (2017). In fresh water, in sediment and in the soft tissues of Spathopsis rubens. Some enzyme activities were detected as; CAT, SOD, GPx and MDA. The total protein, Lipid and carbohydrates in the soft tissues of Spathposis rubens were detected. There is a general acceptance that fresh water ecosystems undergo little ecological stress when subjected to salinities up to 1000 mgL-1. Much of the knowledge of the impacts of salinity on aquatic ecosystems comes from field sampling a long a gradient of salinity from which it is difficult attribute cause of ecological change 47.
Bivalves have been used as bioindicators of pollution because they have the ability to concentrate heavy metals to several other magnitudes 48. The mean concentrations of Fe in the present study are within the permissible limits of law 48/1982 (<1 mg/l) and the guideline of 49 which is <1 mg/l. The mean concentration level of copper is within the permissible limits of law 48/1982 (<1.0 mg/l), the values of the measured metal. The mean levels of the heavy metals in water are less than that of the permissible limits recommended by 50. The changes in metabolic rates of bivalves within the seasons and the variation in bioavailability of metals in the surrounding environment with time might be responsible for the health status of the molluscs 51. The present study is in agreement with Cossa and Rondeau 51 in that the higher metal burden and concentration in the wet season (such as for Fe and Zn). Lower levels for Cd and Hg could be attributed to wash out of the lagoons during the rainy period. Biological variables such as changes in the tissue composition as well as the season of sampling and the hydrodynamics of the lagoons have to be considered. Seasonal variations are related to a great extent to seasonal changes in flesh weight during development of gonadic tissues 52.
The present observation showed that the mean concentration levels of Cu, Hg and Fe in tissues are higher in winter than the other seasons as; the mean concentration level of Hg in winter 1.46 µg/g ˃ spring 1.26µg/g ˃ summer 1.1 µg/g˃ autumn 0.93µg/g. The mean concentration level of Cu in winter 1.6 µg/g˃ spring 1.4µg/g ˃ summer 1.14µg/g˃ Autumn 1.35µg/g and the mean concentration level of Fe in winter 322.33 µg/g˃ Autumn 299.67µg/g ˃ summer 274.17 µg/g˃ spring 252.33µg/g. The mean concentration levels of Pb and Mg are higher in autumn than the other seasons as Pb in Autumn 1.73 µg/g˃ winter 1.65µg/g ˃ spring 1.32µg/g˃ summer 0.89µg/g, Mg in autumn 2.6 µg/g˃ spring 2.38µg/g ˃ summer 2.4µg/g˃ Autumn 1.73µg/g. The mean concentration level of Zn is higher in summer than the other seasons as, Zn in summer 4.23 µg/g˃ spring 2.83µg/g ˃ winter 2.17µg/g˃ autumn 2.08µg/g.
The present observation showed that the mean concentrations level of heavy metal in the sediment were high when compared with standard values 48. The mean concentration level of Hg in sediment is higher in winter than the other seasons as, winter 2.3 µg/g ˃ summer 2.2 µg/g ˃Autumn 2.1 µg/g ˃ spring 1.9 µg/g.The mean concentration level of Zn, Cu, Pb, Fe and Mg were higher in summer than the other seasons as; Zn in summer 8.1 µg/g ˃ spring 5.2 µg/g winter 4.5 µg/g ˃ Autumn 4.2 µg/g, Cu in summer 3.1 µg/g ˃ spring 2.3 µg/g ˃ Autumn 2.2 µg/g ˃ winter 2 µg/g, Pb in summer 2.9 µg/g ˃ spring 2.6 µg/g ˃ winter 2.5 µg/g˃Autumn 2.2 µg/g. Fe in summer 492 µg/g ˃ Autumn 417 µg/gram ˃ spring 400 µg/gram ˃ winter 395 µg/g, Mg in summer 4.8 µg/gram ˃ spring 4.1 µg/gram ˃ Autumn 3.7 µg/gram ˃ winter 3.5 µg/g.The variations in metal concentration of the shellfish tissues in the present study could be related to the concentration of heavy metals in the fresh water.
Abdulah 53 reported that the high level of heavy metals in the lake may be related to their concentration in the stream and rivers discharging into the lake. The high level of Zn, Cu and Pb in the river indicates the quality of the water prevailing at the period of sampling. Trace metal concentrations in clams depend on numerous environmental and biological factors 54. Earlier studies by Chouba et al. 55 in Tunisia demonstrated higher concentrations of heavy metals in clams during high rainfall periods. These findings are in agreement with that of the present study. Studies have shown that during the spawning period, proteins and carbohydrate contents, which have a high affinity for heavy metals, are accumulated for gonad tissue production, energetic storage and consumption 56.There is no access waste water treatment in Abo Hummus rural areas as 20% of Egyptian villages have inadequate potable water 57, 58.
Pollution of the aquatic environment by inorganic and organic chemicals is a major factor posing a serious threat to the survival of aquatic organisms 59. The aquatic environment is subjected to various types of pollutants which enter water bodies 60. It is estimated that the total amount of reused treated wastewater in Egypt was about 1.4 billion m3 in 2000 61. Industrial waste water is considered the second of the main sources of Nile water pollution. Effluent wastewater is often partially treated 62. Major pollutants in agricultural drains are salts, nutrients, pesticide residues, pathogens and toxic organic and inorganic pollutants 63, 64. At high pollution stress however, protein synthesis can be suppressed indicating disturbance of normal metabolic processes 65, 66, 67. The fall in protein level during pollutant exposure may be due to increased catabolism and decrease in protein synthesis 68. The digestive gland is the main site of degradation and detoxification of toxicants and hence resulting into increasing utilization of protein to meet energy demand. The higher degradation of protein is the tool to access the extent of toxicity 69.
In the present study there is a significance between all seasons in the protein content in the soft tissue of Spathopsis rubens as the mean concentration level in Spring was reported as 102.83mg/g which is higher then that of autumn 100.5 mg/g, summer 93.33 mg/g and winter 80.50 mg/g. Kharat et al. 70 studied depletion in protein content in the tissues of Macrobrachium kistnensis exposed to different concentrations of tributyltin chloride stress on protein metabolism similar results were obtained by Sole and Porte 71. Inhibition in the protein synthesis was reported to be due to non-selective blocking of phosphorylation process in the central nervous system 72. Bivalves generally store carbohydrates in large amounts during their growing seasons and use them over the rest of the year although proteins may be an energy reserve in some bivalve species. Lipids have been reported to function most importantly as energy storage substances and physical properties of biological membranes. In the present study the higher concentration of lipid in autumn 12.78 mg/g than in winter 10.60 mg/g, spring 10.25 mg/g and in summer 9.38mg/g. Fall in carbohydrates level may be due to the prolonged exposure of the metabolism to the heavy metals and this may be the reason for inactivation of the enzyme, involved in the carbohydrate metabolism 73. In the present study the higher concentration of carbohydrates was found in spring 13.40 mg/gm than in autumn 12.05 mg/gm, summer 11.78 mg/gm and in winter 10.62mg/gm.
Free radicals are able to react with biological macromolecules and produce enzyme activation, lipid peroxidation 74. Antioxidant enzymes activity levels of marine bivalve Perna viridis during heavy metals exposure were significantly higher in tissues. The mantle was observed to significantly contribute to the organismal response to lipid peroxidation as indicated by high activity levels of antioxidant enzymes 75. Cu strongly stimulates the lipid peroxidation damage of the gill plasma membranes 76, 77. Pannunzio and Storey 78 observed a suppression of GPx activity during anoxia exposure in the hepatopancreas of the marine gastropods Littorina littorea. Main enzymes involved in detoxification from reactive oxygen species. SOD and GPx have been shown to contribute to antioxidant defense in the mussels 79. Glutathione is considered a scavenger able to protect cells from oxidative damage 80, 81. Aerobic organisms are protected against oxidative stress by antioxidant systems which mobilis enzymes such as the (Cu-Zn superoxide dismutase) which transfers O2 to H2O282.
Oxidative stress induced by copper exposure, evidenced by increased lipid peroxidation products such as malondi aldehyde has also been demonstrated for the mussels Mytilus galloprovincialis 83, Perna perna 84, Ruditapes decussatus 85, and for the oyster Crassostrea virginica 86. Antioxidant defenses may be increased or inhibited by chemical stressors. The occurrence of one kind of response or the other depends on the intensity and duration of the applied stress and the susceptibility of the species that are exposed 87. There are several reports on increased SOD and CAT activities in bivalves in the presence of excess free radicals 88. Dietary copper appears to be innocuous to the digestive system at low concentrations as copper is a cofactor of enzymes such as cytosolic SOD (Cu-SODiso-enzyme) 89 and is also part of the hemocyanin molecule. The excess of this metal could be sequestered into vacuoles or immobilized by biological compounds for a possible excretion 90, 91. Metals can induce oxyradical production leading to lipid peroxidation 92. In the present study the mean activity level of GPx in Spring was higher than the other seasons such as spring 31.33U/g ˃ summer 28.33 U/g ˃autumn 26.67 U/g ˃ winter 20.50U/g. The mean activity level of SOD in summer was higher than the other seasons such as summer 38.83 U/g ˃ spring 33.33 U/g ˃autumn 28.83U/g ˃ winter 22.83U/g. The mean activity level of CAT in spring was higher than the other seasons such as spring 25.67U/g ˃ summer and autumn19.83U/g ˃ winter 15.17U/g. The mean activity level of MDA in winter was 30.50 U/g ˃ summer 22.50U/g ˃ autumn 18.0 U/g ˃spring 16.83U/g. In the present study it was found that the mean activity level of MDA increased in winter at the same time the mean activity level of CAT, SOD and GPx were decreased in winter.
Conclusion
Fe, Hg and Cu are higher in winter season while Pb, Zn and Mg are higher in summer in tissue of Spathopsis rubens. Pb and Hg are higher in winter season, Zn, Fe and Mg are higher in summerWhile Cu is higher in summer and winter in fresh water. Fe, Zn, Cu, Pb and Mg are higher in summer while Hg is higher in winter in sediment.
The high ratio of protein and carbohydrates in spring while the higher ratio of lipids in autumn.CAT, GPx are higher in spring, SOD is higher in summer while MDA is higher in winter .By the effect of aquaculture activities, irrigation, mechanized farming and future increased loading of agro-industrial effluents and domestic waste, The pollution increase in winter due to rain water (winter) which move pollutants to river Nile and the effect of pollutants appear in Spathopsis rubens on the following season, this effect has a disturbance of ecosystem and food chains in the aquatic environment.
References
- 1.El-Sheekh M M. (2016) River Nile pollutants and their effect on life forms and water quality. In: Dumont HJ (ed) The Nile: origin, environments, limnology and human use. Doi: 10.1007/698-2016-97.Springer International publishing Hdb Env chem.
- 3.Amer A S, Abdel Gawad HA. (2012) Rapid bioindicators assessment of macrobiotic pollution on aquatic environment. , Int Water Technol J 2(3), 196-206.
- 4.Bekhiet. (2015) Determination of Heavy Metals in Fish Tissues and Water from White Nile Khartoum City –. , Sudan J of Environ Protect and Sustainable Development 1(3), 178-181.
- 5.Ayodele J T, Abubakar M B. (2001) Cleopatra bulimode and Mutelarubens as bio-indicators of heavy metals in river wudil. , Kano Nigeria, Research Journal of Science,7:Nos.1and2
- 6.Ayodele J T, Abu Bakar MB. (2000) Trace metal levels in river wudil, Kano Nigeria Trop. , J of Environ. Res 3, 230-237.
- 7.Supian Z, Ikhwanuddin A M. (2002) Population dynamics of freshwater molluscs (Gastropod: Melanoides tuberculata). in Crocker Range Park, Sabah. ASEAN Review of Biodiversity and Environmental Conservation (ARBEC) .
- 8.Mostafa. (2009) Effect of salinity and drought on the survival of Biomphalaria arabica, the intermediate host of Schistosoma mansoni in Saudi Arabia Egyptian Academic. , Journal of Biological Science 1(1), 1-6.
- 9.Ali M, Abdel-Meguid M, Abdin A. (2006) Assessment of floating fish cages impacts on the water, fauna, flora, sediments, aquatic weeds, fish and hydraulics of Damieta branch, Scientific Bulletin, Faculty of Engineering, Helwan UniversityApril2006.
- 10.Spooner D E, Vaughn C C. (2006) Context-dependent effects of freshwater mussels on stream benthic communities. , Freshwater Biology 51, 1016-1021.
- 11.Zimmerman G F, de Szalay FA. (2007) Influence of unionid mussels (Mollusca: Unionidae) on sediment stability: an artificial stream study. , Fundamental and Applied Limnology 168, 299-306.
- 12.L Van Ginneken, Chowdhury M J, Blust R. (1999) Bioavailability of cadmium and zinc to the common carp, Cyprinuscarpio, in complexing environments: a test for the validity of the free ion activity model. , Environ. Toxicol. Chem 18(10), 2295-2304.
- 13.Romero-Ruiz O, M J Amezcua, J L Rodriguez-Ortega, Munoz J, Alhama. (2003) Oxidative stress biomarkers in bivalves transplanted to the gudalquiver estuary after aznalcollar spill,”. , Environmental Toxicology and Chemistry 22, 92-100.
- 14.Chavan V R, Muley. (2014) Effect of heavy metals on liver and gills of fish Cirrhinusmarigala. , Internationalj. Current Microbiology and Applied Sci 3(5), 277-288.
- 15.Kaladharan P, Prema D, Valsala K K, Leelabhai K S, Rajagopalan M. (2005) Trends in heavy metal concentrations in sediment, fin fishes and shellfishes in inshore waters of Cochin, southwest coast of India. , J Mar Biol Ass 47, 1-7.
- 16.D G Smith. (1980) Anatomical studies on Margaritifera margaritifera and Cumberlandia monodonta (Mol lusca: Pelecypoda: Margaritiferidae). , Zoological Journal of the Linnean Society 69, 257-270.
- 17.Kim M, Wolt J D. (2011) Probabilistic risk assessment of dietary cadmium in the South Korean population. Food Aditives and Contaminents: Part A 28:. 62-70.
- 18.Abdel Moneim AM, Al-Kahtani M A, Dlmenshawy O M. (2012) Histopathological biomarkers in gills and liver of Oreochromis niloticus from polluted wetland environments. , Saudi Arabia. Chemosphere 88, 1028-1035.
- 19.Connor O' DL, Khan S, Weishuhn K, Vaughan J, Jefferies A et al. (2008) Growth and nutrient intakes of human milk-fed preterm infants provided with extra energy and nutrients after hospital discharge. 121(4), 766-76.
- 20.Fang Z Q, Cheung R, Wong M H. (2003) Heavy metals in oysters, mussels and clams collected from coastal sites along the Pearl River Delta, South China. , Journal of Environmental Science (China) 15, 9-24.
- 21.Formiga-Cruz M, Allard A K, Conden-Hansson A C, Henshilwood K, Hernroth B E et al. (2003) Evaluation of potential indicators of viral contamination in shellfish and their applicability to diverse geographical areas. , Applied and Environmental Microbiology 69, 1556-1563.
- 22.El-Shenawy N S. (2004) Heavy metal and microbial depuration of the clam Ruditapes decussatus and its effect on bivalve behavior and physiology. , Environmental Toxicology 19, 143-153.
- 23.Radwan E H, Abdel Wahab WM, KhH Radwan. (2012) Ecological and physiological studies on Pinctada radiata (Leach, 1814) collected from Alexandria coastal water (Mediterranean sea. , Egypt. Egypt J Exp Biol (Zool) 8(2), 223-231.
- 24.Radwan E H, ShSh Hamed, Saad G A. (2014) Temporal and spatial effects on some physiological parameters of the bivalve Lithiphaga lithophaga (Linnaeus, 1758) from coastal regions of Alexandria, Egypt. , Open J of ecology 4, 732-743.
- 25.Radwan E H. (2016) Determination of total hydrocarbon and its relation to amino acids found in two bivalve edible species from Alexandria and El Ismailia coast. , Egypt. J Advances in biology 9(5), 1834-1844.
- 26.Radwan E H, Saad G A, ShSh Hamed. (2016) Ultrastructural study on the foot and the shell of the oyster Pinctada radiata (Leach, 1814), Bivalvia: Petridae). J Bioscience and applied research. 2(4), 274-283.
- 27.Radwan E H, Fahmy G H.Saber MKh and Saber MKh (2017). The impact of some organic and inorganic pollutants on fresh water (Rashid branch, River Nile), Egypt. J of advanced in biology. 10(2), 2133-2145.
- 28.Radwan E H, Hassan A A, Fahmy G H, El Shewemi SS, Sh Salam. (2018) Impact of environmental pollutants and parasites on the ultrastructure of the Nile bolti, Oreochromis auruis. , J of Biosciences and applied 4(1), 58-83.
- 29.Palanivelu V, Vijayavel K, Balasubramanian S, Balasubramanian M P. (2005) Influence of insecticidal derivative (Cartap hydrochloride) from the marine polycheate on certain enzyme systems of the fresh water fish Oreochromis mossambicus. , J of Environ Biol 26, 191-195.
- 30.Vutukuru S S. (2005) Acute effect of Hexavalent chromium on survival, oxygen consumption, haematological parameter and some biochemical profiles of the Indian Major carp. , Labeorohita. Int J Environ Res Public Health 2(3), 456-462.
- 31.B J Halliwell, Eds Gutteridge. (1999) . Free Radicals in Biology and Medicine , OxfordUniversityPress,New York 105-245.
- 32.Vinodini R, Narayanan M. (2008) Bioaccumulation of heavy metals in organs of fresh water fish Cyprinus carpio (Common carp). , Int. J. Environ. Sci. Technol 5, 179-182.
- 33.Powell E N, Klinck J M, Hofmann E E. (1996) Modeling diseased oyster populations. II. Triggering mechanisms for Perkinsus marinus epizootics. , J. Shellfish Res 15, 141-65.
- 34.Wilson-Ormond E A, Ellis M S, Powell E N, Kim Y, Li S. (2000) Effects of gas-producing platforms on continental shelf mega fauna in the North West Gulf of Mexico: reproductive status and health. , Int. Rev. Hydrobiol 85, 293-323.
- 35.Ford S. (1985) Chronic infections of Haplosporidiumnelsoni (MSX) in the oyster Crassostrea virginica. , J. Invertebr. Pathol 45, 94-107.
- 36.Charissou A M, Cossu-Leguille, Vasseur P. (2004) Relation ship between two oxidative stress biomarkers, malondialdehyde and 8- oxo 7. 8 dihydro 2 deoxyguanosine in the freshwater bivalve Uniotumidis,” Science of the Total Environment 322, 109-122.
- 37.Gomes J, Lloyd O L, Revitt D M. (2008) The influence of personal protection, environmental hygiene and exposure to pesticides on the health of immigrant farm workers in a desert country.Int.GilY,SinfortC,GuillaumeS,BrunetY,Palagos,B Influence of micrometeorological factors on pesticide loss to the air during vine spraying: Data analysis with statistical and fuzzy inference models. , Biosyst. Eng 100, 184-197.
- 38.SPSS.Major revision, user interface rewritten in Java (solved the problem of having different versions on different platform. Now the Windows, Mac and Linux versions are published at the same time. SPSS also added "Statistics" to the name of the product formerly simply called. , SPSS 16, 17-0.
- 39.Allain C C, Poon L S, Chan R W.Enzymatic determination of total serum cholesterol:. , Clin. Chem 20, 470-5.
- 40.Lowry O H, Rosebrough N J, Farr A L, Randall R J. (1951) Protein measurement with folin phenol reagent. , Journal of Biological Chemistry 195, 265-275.
- 42.Beauchamp C, Fridovich I. (1971) Superoxide dismutase: improved assays and an assay applicable to polyacrylamide gels. , Anal. Biochem 44, 276-286.
- 43.Nishikimi M, Appaji N, Yagi K. (1972) The occurrence of superoxide anion in the reaction of reduced phenazine methosulfate and molecular oxygen. , Biochem Biophys Res Commun.1972Jan31 46(2), 849-54.
- 44.WN Paglia DE and Valentine. (1967) Studies on the Quantitative and Qualitative Characterization of Erythrocyte Glutathione Peroxidase. , Journal of Laboratory and Clinical Medicine 70, 158-169.
- 45.Ohkawa H, Ohishi N, Yagi K. (1979) Assay for lipid peroxides in animal tissues by thiobarbituric acid reaction. , Anal Biochem.1979Jun 95(2), 351-8.
- 46.Pierre M Vermeersch. (2002) Palaeolithic Quarrying Sites. in Upper and Middle Egypt. Leuven University Press.Retrieved13December2017 351.
- 47.Blinna Dean W, Bailey Paul CE. (2001) Land-use influence on stream water quality and diatom communities in Victoria, Australia: a response to secondary salinization, Volume 466,Issue 1–3. 231-244.
- 48.FEPA. (1991) Federal Ministry of Environment. National guidelines and standards for water quality in Nigeria. 14.
- 49.WHO. (1993) World Health organization summary of WHO guidelines for the assessment of herbal medicines. , Herbal Gram 28, 13-14.
- 50.USEPA. (2005) United States Environmental Protection Agency)(2005).Current National Recommended Water Quality Criteria. Fact Sheet(May25,2005).
- 51.Cossa D, Rondeau J G. (1985) Seasonal, geographical and size-induced variability in mercury content of Mytilus edulis in an environment: a reassessment of mercury pollution level in the estuary and gulf of St.
- 52.Otchere F A, Joiris C, Holsbeek L. (2003) Mercury in the bivalves Anadara (Senilis) senilis, Perna perna and Crassostrea tulipa from Ghana. Sci. Total Environ. 304, 369-375.
- 53.Abdullah B A. (1997) Biodiversity study of the aquatic fauna and flora of the Hadejia-Nguru wetlands, HNWCP. , Nguru Nigeria 79-86.
- 54.Kljakovi- Gašpi Z, Ujevi I, Zvonari T, Bari A. (2007) Biomonitoring of trace metals (Cu. in Mali Ston Bay (Eastern Adriatic) using the Mediterranean blue mussel , Cd, Cr, Hg, Pb, Zn .
- 55.Chouba L, Kraiem M, Njimi W, Tissaoui C H, Thompson J R et al. (2007) Seasonal variation of heavy metals (Cd, Pb and Hg) in sediments and in mullet, Mugil cephalus (Mugilidae), from the Ghar El Melh Lagoon (Tunisia). , Waters Bull 4(2007), 45-52.
- 56.Paez-Osuna F, Tron-Mayer L. (1995) Distribution of heavy metals in tissues of the shrimp Penaeus californiensis from the North West of Mexico. , Bull Environ contam Toicol 55, 209-215.
- 57.UNDP. (2008) Egypt Human Development report, Egypt’s social contract: The role of civil society. United Nations Development Programme.
- 59.Saeed S M, Shaker I M. (2008) Assessment of heavy metals pollution in water and sediments and their effect on Oreochromis Niloticus. , J of Molecular Neuroscience 424-428.
- 60.Hereher M E. (2014) Assessing the dynamics of El-Rayan lakes, Egypt, using remote sensing techniques.doi: 10.1007/s12517-014-1356-4.Arab J Geosci.
- 61.Abdel Gawad S, El-Sayed A I. (2008) The effective use of agricultural wastewater in the Nile river delta for multiple uses and livelihoods needs.
- 62.NBI. (2005) Nile Basin water quality monitoring baseline report. Transboundary Environmental Action Project. Nile Basin Initiative (NBI), GEF:UNDP and world Bankwashington D.C .
- 63.APRP. (2002) Water Policy Activity Contract PCE-I-00-96-00002-00 Task order 22, Survey of Nile System Pollution Sources. Rep.No.64: 84
- 64.Roberts B T. (2004) Prion propagation is abolished by a mutation of the primary cytosolic Hsp70 of budding yeast. , Yeast 21(2), 107-17.
- 65.FAO. (1985) Pesticide residue in food 1984. evaluations. Rome, Food and Agriculture Organization.
- 66. (2001) FAO/WHO.Pesticide residues in food 1994. Report of the Joint Meeting of the FAO Panel of Experts on Pesticide Residues. in Food and the Environment and WHO Toxicological and Environmental Core Assessment Groups. Rome, Food and Agriculture Organization of the United Nations (FAO Plant Production and Protection Paper 127) .
- 67.Pottinger T G, T R Carrick, Yeomans W E. (2002) The three-spined stickleback as an environmental sentinel: effects of stressors on whole-body physiological indices. , J. Fish Biol 61, 207-219.
- 68.Wayker, Lomte. (2001) Acute toxiaty of pesticide carbaryl and endosulfan to fresh water bivalve parreysia cylindrical. , Poll. Res 20(1), 25-29.
- 69.Mule M B, Lomte V S. (1995) Copper sulphate induced alterations of protein in freshwater gastropod, Thiara tuberculata. , J. Ecobiol 7(3), 177-180.
- 70.Kharat P S, Laxmi B, Ghoble K B, Shejule R S, Kale et al. (2009) Impact of TBTCl on Total Protein Content in Freshwater Prawn, Macro brachium kistnensis. , Khartoum City Sudan, Middle-East Journal of Scientific Research 4(3), 180-184.
- 71.Sole M, Porte C, Biosca X, Mitchelmore C L, Chipman J K et al. (2000) Effects of the “Aegean Sea” oil spill on biotransformation enzymes, oxidative stress and DNA-adducts in digestive gland of the mussel (Mytilus edulis L). , Comp. Biochem. Physiol 113, 257-265.
- 72.Kawamata O, Rasotoa B, Omata S, Sugano H. (1987) Decrease in protein phosphorylation in central and peripheral nervous tissue of methyl mercury treated rats. , Arch. Toxicol 59(5), 346-352.
- 73.Vijayaraman K, John G, Mohamed Sivakumar. (1999) Up take and loss of heavy metals by the fresh water prawn Macro brachium malcolmsonii. , J of environ Biol 20(3), 217-222.
- 74.Bagchi D, Hassoun E A, Bagchi M, Stohs S J. (1995) Protective effects of free radical scavengers and antioxidants against smokeless tobacco extract (STE)-induced oxidative stress in macrophage J774A.1.
- 75.Prakash N, JKS Rao. (1995) Relationship between the metal content in bivalve shell and physical parameters. , Fresenius Environmental Bulletin 2(9), 509-513.
- 76.Viarengo A, Canesi L, Pertica M, Livingstone D R. (1993) Seasonal variations in the antioxidant defense systems and lipid peroxidation of the digestive glands of mussels. , Comp. Biochem. Physiol 100-187.
- 77.David E Kelley. (2005) Skeletal muscle fat oxidation: timing and flexibility are everything. , J Clin Invest.2005Jul1; 115(7), 1699-1702.
- 78.Pannunzio T M, Storey K B. (1998) Antioxidant defenses and lipid peroxidation during anoxia stress and aerobic recovery in the marine gastropod Littorina littorea. , Journal of Experimental Marine Biology and Ecology 221, 277-292.
- 79.Gamble S, PS Gold Farb, Porte C, Livingston D R. (1995) Glutathione peroxidase and other antioxidant enzyme function. in marine invertebrates (Mytilus edulis, Pecten maximu, Cacinus maenas and Asterias rubens). Mar. Env.Res.39: 191-195.
- 81.Petushok N, Gabryelak T, Palecz D, Zavodnik L, Varga I S et al. (2002) Comparative study of the xenobiotic metabolising system in the digestive gland of the bivalve mollusk in different aquatic ecosystems and in aquaria experiments. , Aquatic Toxicology 61, 65-72.
- 82.Manduzio H, Monsinjon T, Rocher B, Leboulenger F, Galap C. (2003) Characterization of an inducible isoform of the Cu/Zn superoxide dismutase in the blue mussel Mytilus edulis. , Aquat. Toxicol 64, 73-83.
- 83.Viarengo A, Canesi L, Pertica M, Poli G, Moore M N et al. (1990) Heavy metals effects on lipid peroxidation in the tissues of Mytilus galloprovincialis. , Comp. Biochem. Physiol. C 97, 37-42.
- 84.Almeida E A, Miyamoto S, ACD Bainy, Medeirosm M H, Mascio P D. (2004) Protective effects of phospholipid hydroperoxide glutathinone peroxidase (PHGPx) against lipid peroxidation in mussels Perna perna exposed to different metals. , Mar. Pollut. Bull 49(5), 386-392.
- 85.Geret F, Jouan A, Turpin V, Bebianno M J, Cosson R P. (2002) Influence of metal exposure on metallothionein syntheis and lipid Peroxidation in two bivalve mollusks: the oyster (Crassostrea gigas) and the mussel (Mytilus edulis),” Aquatic Living Resources.15:. 61-66.
- 87.Bebianno M J, Company R, Serafim A, Cosson R P. (2005) Fiala-Medoni A. , Aquat. Toxicol 75, 354-373.
- 88.Fournier M, Cyr D, Blakley B, Boermans H, Brousseau P. (2000) Phagocytic activity as a biomarker of immunotoxicity in wildlife species exposed to environmental xenobiotics. , Am. Zool 40, 412-420.
- 89.Markossian K A, Kurganov B I. (2003) Copper chaperones, intracellular copper trafficking proteins. Function, structure
- 90.Lanno R P, Brad Hicks B, Hilton J W. (1987) Histological observations on intra hepatocytic copper-containing granules in rainbow trout reared on diets containing elevated levels of copper. , Aquat. Toxicol 10, 251-263.
Cited by (22)
This article has been cited by 22 scholarly works according to:
Citing Articles:
Fishes (2025) OpenAlex
Fishes (2025) Crossref
Zoran Kiralj, Zrinka Dragun, J. Lajtner, Krešimira Trgovčić, Tatjana Mijošek Pavin et al. - Fishes (2025) Semantic Scholar
BMC Zoology (2024) OpenAlex
BMC Zoology (2024) Crossref
Ola Mohamed Nour, Salwa A. El-Saidy, Aml Z. Ghoneim - BMC Zoology (2024) Semantic Scholar
Biointerface Research in Applied Chemistry (2022) OpenAlex
Journal of Thermal Biology (2022) Crossref
International Journal of Environmental Science and Technology (2022) Crossref
Mohamed M. Elghazaly, E. Radwan, Ghada A. Tabl, Nisreen El Gendy, K. Radwan - (2021) Semantic Scholar
Journal of Thermal Biology (2021) OpenAlex
R. .. Said, S. Nassar - Journal of Thermal Biology (2021) Semantic Scholar
Jurnal Ilmu Lingkungan (2021) OpenAlex
Laily Agustina Rahmawati, N. Afiati, T. Putranto - (2021) Semantic Scholar
International Journal of Environmental Science and Technology (2021) OpenAlex
A. Khonok, M. Tabrizi, H. Babazadeh, A. Saremi, M. M. Ghaleni - International Journal of Environmental Science and Technology (2021) Semantic Scholar
JOURNAL OF ADVANCES IN BIOLOGY (2020) OpenAlex
E. Radwan, Mohamed M. Elghazaly, H. K. Hussein, K. K. A. Aziz, A. Barakat - JOURNAL OF ADVANCES IN BIOLOGY (2020) Semantic Scholar
International Journal of Limnology (2020) OpenAlex
International Journal of Limnology (2020) Crossref
JOURNAL OF ADVANCES IN BIOLOGY (2020) OpenAlex
E. Radwan, Mohamed M. Elghazaly, KK Abdel Aziz, A. Barakat, H. Hussein - JOURNAL OF ADVANCES IN BIOLOGY (2020) Semantic Scholar
Journal Of Obesity Management (2019) OpenAlex
NA El ghazaly, E. Radwan, Hala H Zaatout, Mohamed M. Elghazaly, N. Allam - Journal Of Obesity Management (2019) Semantic Scholar
International Journal of Aquaculture Research and Development (2019) OpenAlex
International Journal of Aquaculture Research and Development (2019) Crossref
E. Radwan, El-Hassan M. Mokhamer, K. Radwan, M. Elsaka - International Journal of Aquaculture Research and Development (2019) Semantic Scholar