
Abstract
Background:
Antioxidants play an important role in maintenance of human health and prevention of disease. Effective supplementation of antioxidants requires laboratory monitoring of antioxidant status. An understanding of the methods used to determine the TAS helps in better interpretation of values obtained using a particular method and also to select a suitable method.
Material and Methods:
Forty subjects including 25 healthy volunteers and 15 patients diagnosed with rheumatoid arthritis were studied. All samples were analysed for TAS using Ferric reducing ability of plasma (FRAP) method and Trolox equivalent antioxidant capacity (TEAC) assay.
Results:
Mean TAS values obtained by TEAC method were higher than those obtained by FRAP method (p<0.0001); no difference was observed when TEAC values were corrected for proteins and FRAP values were corrected for uric acid (p=0.420). No correlation was found between TEAC and FRAP methods (p=0.102). However, when TEAC was corrected for proteins, positive correlation was observed with FRAP (p=0.044). There was agreement between the two methods when TEAC values were corrected for proteins.
Conclusion:
Although the reaction conditions differ, similar compounds react in both the assays and thus TEAC and FRAP assays are comparable. However, the two methods differ with respect to –SH groups and uric acid contributions. This contributes to the higher TAS values obtained by TEAC assay. Thus, in conditions with altered protein or uric acid levels, the two methods may not be used interchangeably. The TEAC assay is to be corrected for protein for comparison of reports of the two assays.
Author Contributions
Academic Editor: Sudhiranjan Gupta, Texas A&M University
Checked for plagiarism: Yes
Review by: Single-blind
Copyright © 2015 P.V.L.N.Srinivasa Rao, et al.
 This is an open-access article distributed under the terms of the Creative Commons Attribution License, which permits unrestricted use, distribution, and reproduction in any medium, provided the original author and source are credited.
Competing interests
The authors have declared that no competing interests exist.
Citation:
Introduction
Cells, tissues and body fluids have developed effective antioxidant defence systems that help to counteract the oxidative challenge posed by potentially harmful free radicals which are generated continuously during cellular metabolism. To match with the diversity of the pro-oxidants, the antioxidant defence mechanism comprises various components which include enzymatic and non-enzymatic antioxidants 1. Superoxide dismutase, glutathione peroxidase, glutathione reductase and catalase are important enzymatic antioxidants whereas albumin, ascorbic acid, glutathione, uric acid, tocopherol, carotenoids comprise major non-enzymatic antioxidants 2.These antioxidant molecules protect the body from free radical induced damage by preventing formation of free radicals, scavenging them or by promoting their decomposition 3. An increase in oxidants and/or a decrease in antioxidants can shift the balance towards a state of oxidative stress that has been implicated in over 100 disorders 4. In this context, the role of antioxidants in the maintenance of human health and prevention of diseases has attracted attention as some of them can be supplemented. Therapeutic interventions have to aim at either decreasing the exposure of patient to reactive metabolites or supplementing with antioxidants, to counter the oxidative stress. Antioxidant supplementation, to be effective, needs laboratory monitoring of antioxidant status, which further helps in evaluating the effect of treatment on plasma redox status 5 and the ability of an individual to withstand the oxidative stress. Thus, the main hindrance for antioxidant therapy is the need to monitor several parameters. Measuring individual parameters and making necessary specific supplementations is a tedious process that may not be a clinically viable option. So the aim would be to consider methods that measure the combined antioxidant status of the individual rather than individual parameters. Assays like homocysteine levels or GSH, GSSG levels, total NADPH oxidases, superoxide dismutase, catalase measure respective individual antioxidant activities and do not represent total antioxidant capacity. Measured total antioxidant response of a sample is known as total antioxidant status (TAS) 6, total antioxidant capacity (TAC) 7, or other synonyms 8.
Several methods have been developed for the measurement of TAS along with their automation. The most widely used methods are based on colorimetric, fluorescence and chemiluminiscence assays 9, 10, 11. The fluorescence and chemiluminiscence methods require sophisticated techniques and are not commonly employed in most routine biochemistry laboratories 12. The Ferric reducing ability of plasma (FRAP) assay 13, 14 and ABTS (2,2’- azinobis3-ethyl benzothiazoline 6- sulfonate) based methods 7, 15 are the colorimetric methods which are more commonly used. The trolox equivalent antioxidant capacity (TEAC) assay is an ABTS based method for TAS estimation. Trolox (6 – hydroxy- 2,5,7,8 – tetramethylchroman -2- carboxylic acid) is a water soluble analogue of vitamin E 8.
Measured TAS of a sample depends on the method used for its estimation. The methods differ with respect to the components measured. Moreover, various components of TAS are affected in different clinical situations implicated in causing oxidative stress such as uric acid in chronic kidney disease. Hence, there is a need for the identification of suitable method for the measurement of TAS. Comparison of different analytical methods for TAS measurement constitutes an important factor to select a convenient method and also to understand and interpret the results obtained using a particular method for TAS estimation as well as its suitability to monitor antioxidant supplementation. In this background, we evaluated two commonly used methods, the FRAP and TEAC assays for estimation of TAS with respect to the major components measured, clinical utility and comparative interpretation of results.
Materials and Methods
Subjects:
Blood samples were obtained from forty subjects (36 females and 4 males; mean age 42.65 ± 11.89 years; BMI 20.55 ± 1.90(kg / m2)). 25 healthy volunteers and 15 patients with rheumatoid arthritis (RA), a known oxidative stress condition, were included in the study to cover physiological and pathological ranges of TAS. The study was approved by institutional ethics committee (IEC number: 420 issued by Sri Venkateswara Institute of Medical Sciences, Tirupati, the place of work). Venous blood samples were collected into plain tubes after informed consent. Serum was separated by centrifugation and transferred into appropriately labelled aliquots and stored at –80oC until further analysis.
Methods:
FRAP assay: FRAP assay was performed as per the method described by Benzie and Strain. In this method, colourless Fe3+- TPTZ (Ferric – 2,4,6-tri pyridyl –s- triazine) complex is reduced to blue coloured Fe2+- TPTZ (Ferrous – 2,4,6-tri pyridyl –s- triazine) complex at an acidic pH (3.6) which has an absorption maximum at 593 nm. The reduction of the complex leading to colour development occurs in the presence of antioxidants present in the sample added and is a measure of the reducing ability of the sample 13. Sigma grade chemicals were used for analysis and absorbance was measured on Perkin Elmer Lambda 1.2 UV VIS double beam Spectrophotometer.
TEAC Assay:
The Trolox equivalent antioxidant capacity (TEAC) assay was performed on Beckman Coulter Synchron CX 5 fully automated auto analyser (USA) using commercial kit obtained from Randox laboratories (United Kingdom) as per the method protocol. The assay is based on the inhibition of the absorbance of the radical cation of ABTS (2,2’- azinobis3-ethyl benzothiazoline 6- sulfonate) by the antioxidants in the sample. ABTS radical cation is generated from ABTS and H2O2 in the presence of metmyoglobin as peroxidase. The radical cation ABTS*+ has a blue green colour measured at 600 nm. The concentration of antioxidant in the sample is inversely proportional to the absorbance of the ABTS radical cation.
Serum total protein (Transasia Bio-medicals Ltd, India) and uric acid (Crest Bio systems, India) were measured on Beckman Coulter Synchron CX 5 auto analyser.
Statistical Analysis:
Continuous variables were expressed as mean ± SD. The difference in the means of TAS measured by the two methods was assessed by paired t- test. The association between various parameters studied was analysed by Pearson correlation. The agreement between the methods was assessed using Bland Altman plots and intra class correlation coefficient (ICC). All the analyses were done using Medcalc statistical software version 13.2.2, Belgium. A p value less than 0.05 was considered as statistically significant.
Results:
The intra assay coefficient of variation by FRAP and TEAC assays was 0.8% and 2.4% respectively. The inter assay coefficient of variation obtained by FRAP and TEAC assays was 3.5% and 4.5% respectively. Mean TAS values obtained by TEAC method were found to be significantly higher than those obtained by FRAP method (p<0.0001). However, when TAS values by TEAC assay were corrected for total proteins and TAS values by FRAP method were corrected for uric acid, no significant difference was observed (p=0.420) (Table 1). The range of values for TEAC and FRAP with and without correction for total protein and uric acid were shown in Figure 1. This shows that the antioxidant activity measured by these parameters is almost the same except for total protein and uric acid (Figure 1D).
Table 1. Comparison of the studied parameters by paired t – test.| parameter | mean±SD | P value |
| TEAC | 1.51±1.03 | <0.0001* |
| FRAP | 0.78±0.23 | |
| TEAC/TP | 0.21±0.14 | <0.0001* |
| FRAP | 0.78±0.23 | |
| TEAC | 1.51±1.03 | <0.0001* |
| FRAP/UA | 0.19±0.05 | |
| TEAC/TP | 0.21±0.14 | 0.42 |
| FRAP/UA | 0.19±0.05 |
Figure 1.Dot plots of the parameters studied. TEAC – Trolox equivalent antioxidant capacity; FRAP – ferric reducing ability of plasma; TP- total proteins; UA-uric acid; TEAC/TP – Total antioxidant status values by TEAC corrected for total proteins; FRAP/UA - Total antioxidant status values by FRAP corrected for uric acid; ICC – intra class correlation coefficient; ICC value close to 1 indicates good agreement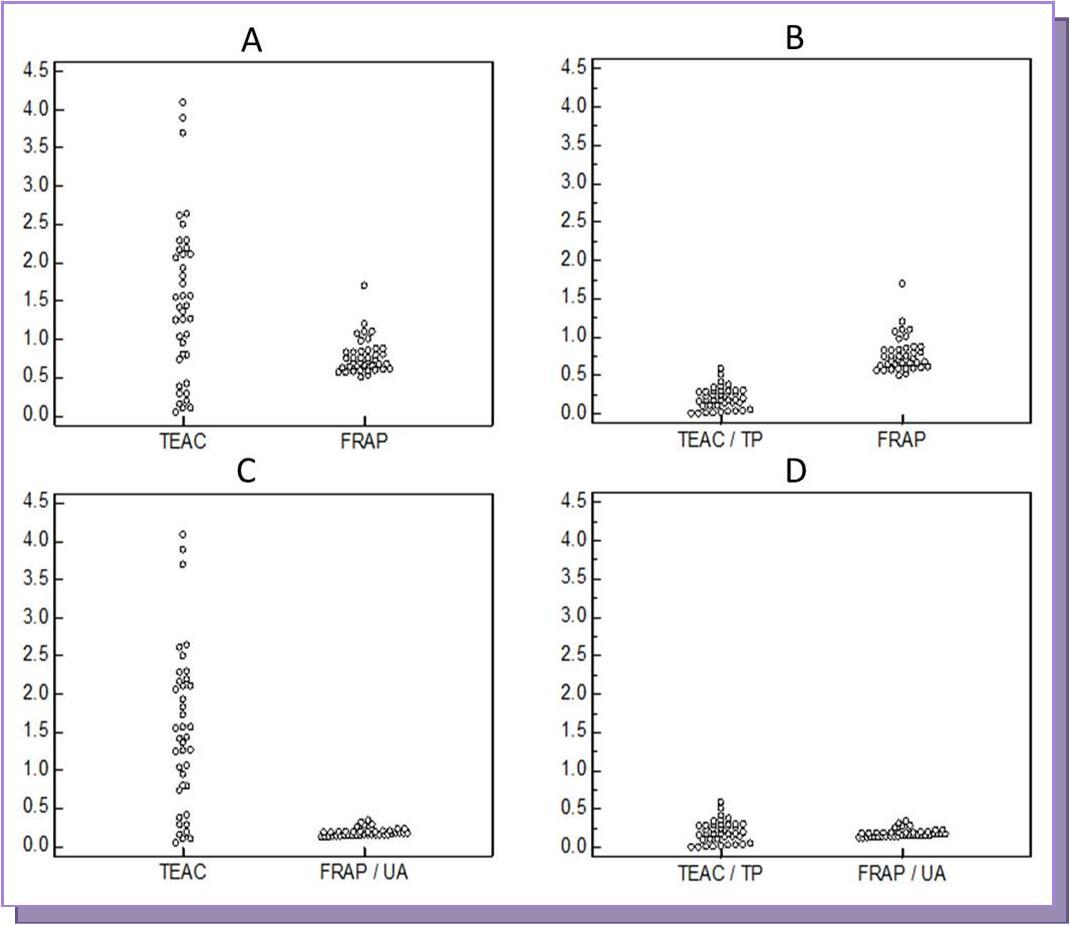
No correlation was observed between TAS values by TEAC and FRAP methods (r=0.262, p=0.102). However, TAS values by TEAC method corrected for total proteins showed significant positive correlation with FRAP (r=0.320, p=0.044). Significant positive correlation was also observed between TAS values obtained by TEAC and Total proteins (r=0.327, p=0.039), and both FRAP and TEAC showed significant positive correlation with UA (r=0.485, p=0.001 and r=0.335, p=0.034 respectively).Table 2 TAS values by TEAC showed poor agreement with FRAP as assessed using Bland Altman plot and ICC (Figure 2-A, ICC=0.1975); also, TAS values by TEAC corrected for total proteins showed poor agreement with TAS values by FRAP corrected for uric acid (Figure 2-C, ICC= -0.0591). However, when TAS values by TEAC were corrected for total proteins, the agreement with FRAP improved (Figure 2-B, ICC=0.4450).
Table 2. Pearson Correlation analysis of the parameters studied| parameter | TEAC | TEAC/TP | TP | UA |
| FRAP | r = 0.262 | r = 0.320 | r = - 0.247 | r = 0.485 |
| p = 0.102 | p = 0.044* | p = 0.125 | p = 0.001* | |
| FRAP/UA | r = -0.058 | r = -0.044 | r = -0.194 | r = -0.414 |
| p = 0.724 | p = 0.786 | p = 0.231 | p = 0.008* | |
| TEAC | - | r = 0.990 | r = 0.327 | r = 0.335 |
| p = <0.0001* | p = 0.039* | p = 0.034* |
Figure 2.Showing Bland-Altman plots comparing TEAC and FRAP methods. TEAC – Trolox equivalent antioxidant capacity; FRAP – ferric reducing ability of plasma; TP- total proteins; UA-uric acid; TEAC/TP – Total antioxidant status values by TEAC corrected for total proteins; FRAP/UA - Total antioxidant status values by FRAP corrected for uric acid; ICC – intra class correlation coefficient; ICC value close to 1 indicates good agreement
Discussion
The present study compared FRAP assay with TEAC assay for assessment of serum antioxidant capacity. The mean total antioxidant status (TAS) of the samples determined by TEAC method was found to be significantly higher than that obtained by FRAP method (p < 0.0001). Serum contains different antioxidant compounds and the TAS of a sample depends upon the method employed for its measurement as the methods differ in their ability to measure different components of the serum that contribute to the total antioxidant capacity. Proteins are the major contributors to the antioxidant capacity of serum through their sulfhydryl (-SH) groups. Free sulfhydryl groups of serum mainly belong to proteins because the serum concentration of other –SH containing compounds such as linoleic acid is very low 12. The TEAC assay determines the antioxidant effects of proteins as one of the components whereas FRAP assay includes insignificant amount of protein as a component 12. This may account for the higher values obtained by TEAC method. However, the difference between the two methods was still present when TEAC was corrected for proteins (p < 0.0001).This probably could be due to the difference in the contribution of uric acid component (61.7% and 19.3% for FRAP and TEAC assays respectively) to the assay (Figure 1B) 16. Hence, we corrected both the assays for their major components (TEAC/TP Vs FRAP/UA) and this eliminated the difference between the parameters (p=0.420). This shows that TEAC and FRAP assays largely differ with respect to measurement of –SH groups and uric acid. This is also evident in the range of TEAC/TP and FRAP/UA values as shown in Figure 1D.
When the relationship between the FRAP assay and TEAC assay was analysed, no significant correlation was observed (p=0.102). However, significant positive correlation was observed only when TEAC method was corrected for total proteins (r=0.320, p=0.044).This is similar to an earlier study done by Cao G and Prior RL 16 in which no correlation was reported between FRAP and TEAC assay. However, they did not study the correlation after correcting for the protein component of TEAC assay. Both FRAP and TEAC showed significant positive correlation with uric acid levels (p=0.001 and 0.034 respectively), whereas TEAC showed significant positive correlation with total proteins (p=0.039), thus suggesting that total proteins form the major components of TEAC and uric acid forms the major component of FRAP, although measured by both methods. The correlations observed contrary to scientific logic between FRAP/UA Vs TEAC/TP and FRAP/UA Vs UA could possibly be due to the small sample size.
When we further evaluated for the agreement between FRAP and TEAC assays using Bland Altman plot and ICC, we could not observe good agreement (Figure 2-A) between the two methods. This is expected and can be explained based on the fact that the parameters measured by the two methods are different. However, TAS values by TEAC method corrected for total proteins showed better agreement with TAS values by FRAP method (Figure 2-B). This indicates that the main difference between the two assays is measurement of proteins and the antioxidant status measured by both assays is comparable. Moreover, although the reaction conditions differ, since the reduction potential of Fe3+-TPTZ and ABTS.* are comparable, similar compounds react in both the assays 17. Hence, we have included these two assays for comparison. However, in conditions where uric acid, one of the main components measured by FRAP method, is altered, measurement of TAS using TEAC method may be beneficial; likewise, in conditions affecting total protein levels, FRAP method may be useful.
Conclusion
The mean TAS values obtained by FRAP method were lower than those obtained by TEAC method as the FRAP method does not measure the –SH containing antioxidants, mainly contributed by proteins. Moreover, although the reaction conditions differ, since the reduction potential of Fe3+-TPTZ and ABTS.* are comparable, similar compounds react in both the assays 17.The FRAP assay is simple and inexpensive but does not measure –SH containing antioxidants. The TEAC assay measures the antioxidative effects of –SH containing antioxidants also. Thus, although both FRAP and TEAC methods are comparable and can be used for measuring the anti oxidant capacity, the two methods may not be used interchangeably when there are alterations in protein and uric acid levels. If reports from these two methods have to be matched for any reason, TEAC corrected for total proteins can be used to compare with FRAP values.
Acknowledgements
The authors acknowledge the support of Randox Laboratories India Pvt Ltd. for supplying the TEAC assay reagent kit.
References
- 2.Yu B P. (1994) Cellular defenses against damage from reactive oxygen species. Physiol Rev. 74, 139-62.
- 3.Vassalle C, Masini S, Carpeggiani C, L’Abbate A, Boni C et al. (2004) In vivo total antioxidant capacity: comparison of two different analytical methods. Clin Chem Lab Med. 42, 84-9.
- 4.Halliwell B, JMC Gutteridge.Free radicals in biology and medicine. Third ed. Oxford: Oxford Science Publications; 2000.p 617-24.
- 5.Ghiselli A, Serafini M, Natella F, Scaccini C. (2000) Total antioxidant capacity as a tool to assess redox status: critical view and experimental data. Free Radic Biol Med. 29, 1106-14.
- 6.Rice-Evans C, Miller N J. (1994) Total antioxidant status in plasma and body fluids. , Methods Enzymol 234, 279-93.
- 7.Miller N J, Rice-Evans C, Davies M J, Gopinathan V, Milner A. (1993) A novel method for measuring antioxidant capacity and its application to monitoring the antioxidant status in premature neonates. Clin Sci. 84, 407-12.
- 8.Erel O. (2004) A novel automated method to measure total antioxidant response against potent free radical reactions. Clin Biochem. 37, 112-9.
- 9.Schlesier K, Harwat M, Böhm V, Bitsch R. (2002) Assessment of antioxidant activity by using different in vitro methods. Free Radic Res. 36, 177-87.
- 10.Janaszewska A, Bartosz G. (2002) Assay of total antioxidant capacity: comparison of four methods as applied to human blood plasma. , Scand J Clin Lab Invest 62, 231-6.
- 11.Prior R L, Cao G. (1999) In vivo total antioxidant capacity: comparison of different analytical methods. Free Radic Biol Med. 27, 1173-81.
- 12.Erel O. (2004) A novel automated direct measurement method for total antioxidant capacity using a new generation, more stable ABTS radical cation. Clin Biochem. 37, 277-85.
- 13.Benzie I F, Strain J J. (1996) The ferric reducing ability of plasma (FRAP) as a measure of “antioxidant power”: the FRAP assay. , Anal Biochem 239, 70-6.
- 14.Benzie I F, Strain J J. (1999) Ferric reducing/antioxidant power assay: direct measure of total antioxidant activity of biological fluids and modified version for simultaneous measurement of total antioxidant power and ascorbic acid concentration. , Methods Enzymol 299, 15-27.
- 15.Re R, Pellegrini N, Proteggente A, Pannala A, Yang M et al. (1999) Antioxidant activity applying an improved ABTS radical cation decolorization assay. Free Radic Biol Med. 26, 1231-7.
Cited by (6)
- 1.Langille Evan, Lemieux Vincent, Garant Dany, Bergeron Patrick, Chen Oliver, 2018, Development of small blood volume assays for the measurement of oxidative stress markers in mammals, PLOS ONE, 13(12), e0209802, 10.1371/journal.pone.0209802
- 2.Sirisha Allampalli, Gaur Girwar Singh, Pal Pravati, Bobby Zachariah, Balakumar Bharathi, et al, 2021, Effect of honey and insulin treatment on oxidative stress and nerve conduction in an experimental model of diabetic neuropathy Wistar rats, PLOS ONE, 16(1), e0245395, 10.1371/journal.pone.0245395
- 3.Yan Xuetao, Cheng Xiaoli, Zhou Liwen, He Xianghu, Zheng Wenzhong, et al, 2017, Dexmedetomidine alleviates lipopolysaccharide-induced lung injury in Wistar rats, Oncotarget, 8(27), 44410, 10.18632/oncotarget.17899
- 4.Yin Jie, Wu Miaomiao, Li Yuying, Ren Wenkai, Xiao Hao, et al, 2017, Toxicity assessment of hydrogen peroxide on Toll-like receptor system, apoptosis, and mitochondrial respiration in piglets and IPEC-J2 cells, Oncotarget, 8(2), 3124, 10.18632/oncotarget.13844
- 5.Wang Bin, Li Yansen, Mizu Masami, Furuta Toma, Li ChunMei, 2017, Protective effect of sugar cane extract against dextran sulfate sodium-induced colonic inflammation in mice, Tissue and Cell, 49(1), 8, 10.1016/j.tice.2016.12.008
- 6.Yin Jie, Li Yuying, Han Hui, Zheng Jie, Wang Lijian, et al, 2017, Effects of Lysine deficiency and Lys-Lys dipeptide on cellular apoptosis and amino acids metabolism, Molecular Nutrition & Food Research, 61(9), 1600754, 10.1002/mnfr.201600754