
Abstract
Despite widespread use of Geographic Information System (GIS) technology to strengthening health systems, the application of GIS to health systems strengthening in resource-poor Sub-Saharan Africa remains rare. Over the June 2012 to December 2013 period, the Ghana Health Service (GHS) conducted a pilot application of GIS to health systems development in one rural impoverished district of the Upper East Region (UER). Workers were deployed to gather coordinates of health care facilities throughout the UER. Coordinates were linked to routine health information data, and utilized to generate maps for guiding task prioritization. For example, geocoded Community-based Management of Severe Acute Malnutrition (CMAM) program data were used to target services in communities where the prevalence of childhood acute malnutrition was relatively high. GIS was pivotal in tracking and responding to infectious disease morbidity from causes such as diarrheal diseases and tuberculosis. UER Regional Health Administration (RHA) authorities are currently utilizing GIS to map antenatal care coverage, skilled birth deliveries, neonatal mortality, still births, family planning service caseloads as well as for targeting programmatic action. Experience emerging from this trial attests to the value of GIS in contributing to efforts to strengthen health systems in rural impoverished regions of Africa.
Author Contributions
Academic Editor: Yudong Zhang, Kyushu Institute of Technology, Japan
Checked for plagiarism: Yes
Review by: Single-blind
Copyright © 2017 Eric Asuo-Mante, et al.
 This is an open-access article distributed under the terms of the Creative Commons Attribution License, which permits unrestricted use, distribution, and reproduction in any medium, provided the original author and source are credited.
Competing interests
The authors have declared that no competing interests exist.
Citation:
Introduction
Efforts to improve health systems functionality require geographic data that visualize the areal distribution of the burden of disease. By identifying localities where particular problems are concentrated, geographic mapping facilitates prioritization of resource deployment. In recent decades, a global consensus has emerged that geographic information system (GIS) technology represents the most effective tool for achieving the goal of gathering, storing and visualizing retrievable data, providing managers with the ability to observe, analyze and target localities where resources are best deployed. A consensus has emerged that GIS, if effectively used, can inform, empower and guide health system strategies for protecting human lives.1Equipped with such data, health administrators can be adequately informed about where actions should be targeted or capabilities should be improved. Despite this global consensus, practical application of GIS to health systems strengthening in Africa remain rare. Throughout rural Africa, infectious diseases still present as predominant components of the burden of disease. GIS is particularly important to the processes of tracking and responding to infectious disease outbreaks.
In 2007, the World Health Organization (WHO) published a framework for the strengthening of health systems.2 The WHO framework specified six interlinked “building blocks” comprised of activities and policies that were defined as “pillars” to strengthen health systems.2 Of these, “information for decision-making” represents a critical component of systems functioning. But, developing this vital component of the six-building blocks is impossible to pursue without actionable GIS data. Any effort to improve service delivery by optimizing the deployment of the health workforce or by providing appropriate in-service training, directly benefit from knowledge of the localities where particular risks are most prominent. GIS provides the means to visually represent georeferenced information that identify localities where particular health interventions merit emphasis or action.
This paper addresses two aims. In response to the WHO framework, the case study focuses on the contribution of GIS to the information for decision-making component of health systems strengthening in a severely resource and health deprived Sahelian region of Ghana. To address the need for implementation research on GIS in such settings, we, discuss ways in which the introduction of GIS has improved health in the locale. We conclude with recommendations on how GIS can be critical to developing and sustaining health systems in impoverished regions elsewhere in Africa.
The Upper East Region
Located in north-eastern Ghana, the Upper East Region is bordered to the north by Burkina Faso, to the east by Togo, to the south by the Northern Region and to the west by the Upper West Region. The Upper East Region (UER) is subdivided into 13 districts with the town Bolgatanga as the regional capital (Figure 1). Together with the Upper West Regions, these two Sahelian northern-most regions are the poorest of the 10 regions in Ghana with poverty rates that are estimated to be double the national average.3 A recent demographic survey reported that 79%, of the UER households are in the lowest wealth quintile of the nation.4
Figure 1.District Map of Upper East Region, Ghaana
Typical of much of tropical Africa, childhood infectious disease morbidity dominates the burden of disease. Childhood illnesses, such as malaria, acute respiratory infections, and diarrheal diseases are particularly prominent components of the burden of disease in the UER. Other infectious diseases that are rarely encountered elsewhere remain hyper-endemic in Sahelian Ghana: cholera,5 malaria,6 meningitis,6 and helminthic infections such as schistosomiasis (bilharzia),7 and filariasis.8 Other prevalent infectious diseases include human immunodeficiency virus (HIV/AIDS),6 andPotts disease (tuberculosis related illness).9 Although some diseases approach eradication, such as poliomyelitis, or require comprehensive immunization coverage, such as measles, typhoid, and diphtheria, morbidity to a range of immunizable diseases remains problematic.
Clinical caseloads of these illnesses are routinely recorded by health workers wherever primary health care services are provided. By linking GIS technology with the locations where services are provided, geographic information facilitates the visualization and analysis of routinely compiled service data. Maps show areas where health systems need strengthening or by augmenting statistical information with geographic covariates. Low-cost GIS development activities conducted in Ghana from June 2012 to December 2013 introduced the training of local healthcare workers to be self-sufficient in monitoring geographic health information10 that could be relevant to other parts of Africa.
Mapping Healthcare Locations
All Government of Ghana sponsored health service activities are provided by facilities and staff of the Ghana Health Service (GHS). Policies governing the GHS operations specify a facility hierarchy ranging from 10 regional referral hospitals to 212 districts each equipped with a clinic or hospital, to about four sub-district health centers within each district and to about 4,200 community health posts dispersed throughout the country.11 At the community level these health posts provide a system of outreach and basic primary health care that is referred to as the Community-based Health Planning and Services (CHPS) Initiative. Although CHPS was launched in 2000,12, 13, 14 its implementation is still in progress, with coverage that spans about half of its targeted rural population. CHPS facilities are staffed by Community Health Officers (CHOs) who provide antenatal care, immunization services and a range of family planning services as well as health education. CHOs also provide child welfare, disease surveillance, the treatment of febrile illnesses, and management of other ailments such as snake bites, injuries, and diarrheal diseases. Each CHO is a paid worker who has been provided with 18 months of clinical training supplemented with a six-month practicum assignment.
Each CHPS facility serves a catchment area termed a “zone” typically comprised of three to five villages with a combined population of less than 5,000. CHPS “compounds” where services are provided are strategically placed to focus on preventive care and the provision of basic primary health care. CHPS aims to “transform the primary health care system by shifting to a programme of mobile community-based care provided by a resident nurse, as opposed to conventional facility-based”14 care. Although GHS policy aims to equip each zone with a constructed facility, the location of a CHPS compound can be located in a temporary structure such as a school (after classes or on weekends), a chief’s palace, or an interim facility refurbished or constructed with volunteer labor. The CHPS facilities refer cases to clinics, health centers and hospitals located at the sub-district and district levels. Health centers situated at the sub-district level usually refer cases to district hospitals, which serve as the first referral point in the GHS primary health care system15.The regional hospital (the largest health care establishment in UER) is the second referral level which addresses highly specialized clinical and diagnostic care.11, 15
The GHS manages its district-level primary health care system with a District Director of Health Services and a supporting team of paramedics comprised of medical assistants, disease control officers, and medical assistants or nurses who provide overall supervision to public health services. Termed the “DHMT” for District Health Management Team, this unit oversees the work of a district health information management officer who operates a routine health information system at each point where services are provided. Known as the District Health Information System (DHIMS),16, 17 all episodes of primary care are captured by the system and reported to regional and national authorities quarterly. By developing GIS coordinates for all service points, the pilot provided an automated link between geographic information and reports of service delivery.
Critical to the functioning of any health system, the workforce and access to facilities where personnel are based represents an important facet to strengthening health systems. Knowledge of the locations of health care facility establishments is crucial to understanding the extent to which a system is accessible to the population. This information, combined with data on travel times associated with distance,18, 19 transportation challenges,20 transportation costs21 typically define access. Thus, before research on access can be conducted it is essential to know health facility locations, particularly in areas where infectious disease outbreaks occur, such as the UER. GIS thus represents a critical component of the WHO “pillar” that is specified as “information for decision-making.” To address this issue, the GIS work undertaken in the UER gathered the coordinates of all health facilities throughout the region so that reports of activities, capabilities, and services could have a geographic representation.10
Figures 2a and 2b were generated using Esri’s ArcGIS ArcMap 10.4.1. They display the locations of the 4 main health facility establishments in Ghana- hospitals, health centers, clinics and CHPS in the UER. The Figure 2a and Figure 2b maps show the geographic position of the UER regional hospital and 6 district hospitals, 55 health centers, 41 clinics, and 255 Community-based Health Planning and Services (CHPS) locations - as assessed in 2013.
Figure 2.A) Locations of Hospitals, Health centers and clinics in the Upper East Region. B) Locations of CHPS in the Upper East Region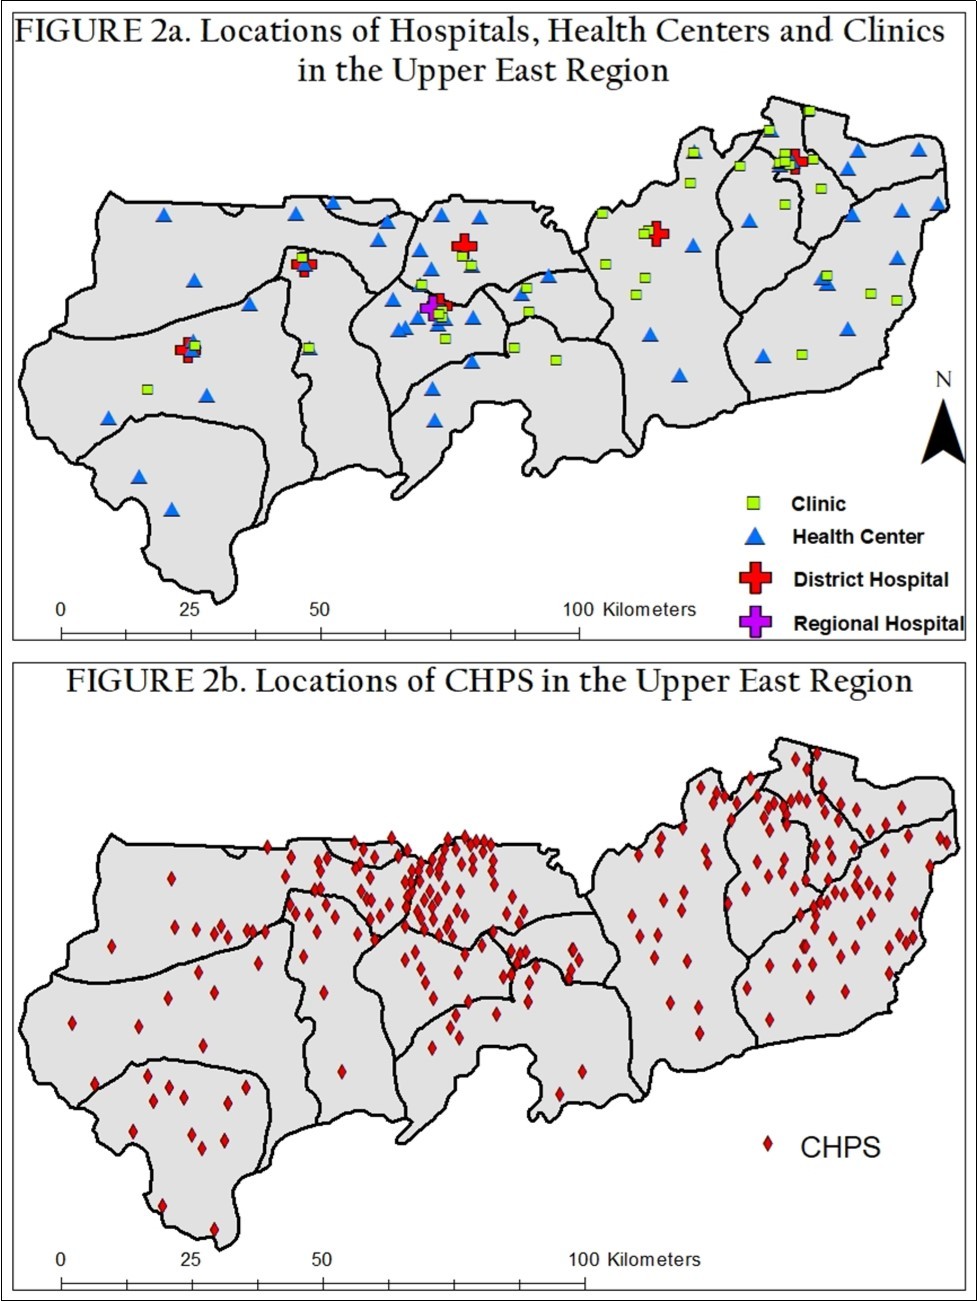
Visualizing the Implications of District Splitting
Before GIS maps were available, it was difficult for the UER health administrators to visualize healthcare locations, calculate travel distances, observe the geographic distribution of the disease burden among communities and geospatially recognize which sectors either needed healthcare interventions or were improving. But, the generation of GIS based maps, such as Figure 2a and Figure 2b, fostered leadership that could be directed to targeting activities that strengthened the health system.
Over the past two decades, acts of Parliament have split the 98 districts that were demarcated in 2000 into 212 districts by the year 2012. In the past 10 years, this process has split the former 9 UER districts into 13 districts. After each division, the Upper East Regional Health Administration (RHA) was obligated to convene corresponding DHMTs 18 and assign responsibilities for health care delivery that were consistent with newly defined district boundaries. GIS has proved to be a useful information tool for understanding the implications of the district splitting policy by clarifying for each DHMT the precise configuration of communities where responsibility for services was to be implemented. This case study focused on the challenge of splitting Builsa District into Builsa North and Builsa South and the practical task of delineating work responsibilities for the DHMT that were affected.
Although all health services were affected by the district split, nutritional surveillance was particularly challenging because prevalence mapping involved surveillance work, delineated by community, rather than incidence mapping based on routine reports. To address this problem, nutritional status data were collected and geocoded separately from clinic records. After the geographic demarcation of new district boundaries, health care administrators in Builsa South utilized the geocoded CHPS data in Figure 2b to identify and rehabilitate nutritionally compromised children. A procedure for capturing the requisite data, referred to as the Community-based Management of Severe Acute Malnutrition (CMAM), aimed to screen for severe-acute malnourished children throughout the Upper East, and report all identified cases to UER healthcare facilities for nutritional supplementation via outpatient care, or through inpatient care at the hospital level for particularly severe cases.
At the commencement of CMAM, regional health administrators organized training sessions for Builsa workers. But after the division of the North from the South, the Builsa South DHMT found that healthcare staff in four out of their 13 CHPS facilities had not received CMAM screening or service training, representing a critical gap in nutritional surveillance capabilities. In response, these workers were trained in CMAM and the Builsa South health administrators sought means of geographically visualizing the number and position of communities that were disadvantaged in terms of CMAM outpatient services. Once implemented, this system enabled managers to monitor the performance of all workers by visualizing areal data on nutritional adversity. Beginning with the knowledge that each CHPS facility has a specific number of communities under their care (between 5–10 communities)11 the DHMT created a multiple ring 1-5-kilometer buffer, shown in Figure 3, the coverage that each CHPS facility would have to achieve if CMAM childhood care were to achieve its targets. A 5-kilometer limit was used because official Ghana Health Service policy aims to ensure universal access to primary health care by establishing a geographic density of CHPS service points that defines a catchment radius that is no greater than 5-kilometers for any given service provision zone.
Figure 3.Multiple Ring Buffer showing CMAM*CHPS coverage among Builsa South communities,2013
After creating the buffers defined by the under-five kilometer criterion, four CHPS facilities (Wupiensa, Jagsa, Kasiesa and Luisa) were found to be responsible for care service in over 10 communities (Figure 3). In some cases, the onsite community workers claimed they had to refer cases to other CHPS locations which were relatively remote and usually difficult to visit. In response to this problem, the health administrators instituted “on the job coaching” at each of the four facilities to orient workers on how to care for severely malnourished children. Follow-up supervisory support was provided for each CHPS health post to ensure that proper care, documentation and case reporting was being followed. Monitoring data suggest that substantial child health improvements have been realized. Results demonstrate that decision-making, in response to GIS can serve as a tool for strengthening health systems in a remote area of rural Africa.
Addressing Diarrhea and Suspected Tuberculosis (TB) cases
CHPS workers who are based in community facilities are responsible for disease surveillance within their respective catchment area communities. This surveillance process involves procedures for identifying, recording and reporting all diseases on both a weekly and monthly basis to the disease control officers at the DHMT- district level- who record them into the Integrated Disease Surveillance and Report monitoring sub-system of DHIMS. Prior to the introduction of GIS, the morbidity reporting system was limited to computerized line lists of disease caseloads at each community, sub-district and district levels. However, with the introduction of GIS mapping technology, the Builsa South DHMT could geocode all the communities in their district, map the location of all communities and the location of health facilities to represent all registered cases by cause of morbidity. The maprevealed that diarrhea and suspected TB cases were particularly high in six communities. Other sources of morbidity had no apparent geographic concentration.
Priority for diarrheal disease and TB control was consigned to conducting preventive measures in the six high incidence localities. Responses involved what was referred to as “sensitization durbars” that provided community members with basic information about the epidemic and measures that could be taken to prevent its spread. The durbars mainly targeted mothers and adults within each community. In addressing diarrhea, attendees were educated on the use of Oral Rehydration Salts (ORS) and zinc as the main forms of treatment. They were provided with both treatment regimens and taught the importance of completing the treatment course for zinc in particular (therapy performed at home for 2-3 days) in order to ensure its effectiveness. Similarly, for TB, attendees were trained in the recognition, reporting, and response implications of each suspected TB case. In particular, workers were instructed to report cases with coughing that lasted for more than a week.
IDSR reports suggest that the burden of disease associated with diarrheal diseases and TB declined in the six communities after the preventive measures were launched. For example, in the Uwasi sub-district, there were three confirmed TB cases before the educational durbars. Directly after the training, four suspected cases were reported to the health facilities where the patients were instructed to provide sputum, engage in therapy, and comply with rigorous monitoring. All four of the suspected TB cases reverted to non-cases, attesting to the value of GIS in supporting the TB case management process.
GIS Activities on a Regional Level
Based on the success of the Builsa South GIS pilot program, the RHA scaled up GIS usage and analysis throughout the UER, commencing with geocoding for facility and community mapping in all 13 districts. A district-wide appraisal has determined which communities lack appropriate access to health facilities. GIS has enabled regional managers to target investment in expanding CHPS coverage in those locations. Furthermore, Builsa South health administrators have helped the Upper East Regional Health Directorate (RHD) in training other DHMT workers in methods for integrating GIS into the IDSR to (i) generate maps showing CMAM case incidence levels region-wide, (ii) use thematic maps to display the antenatal care (ANC) coverage in terms of the “ANC 4 plus visit coverage” (to ensure pregnant mothers are routinely visited at homes in order to avoid pregnancy complications), (iii) generate maps to show areas where deliveries by midwives (skilled delivery) are occurring or deficient, (iv) display areas where neonatal and still births are unusually high, (v) show areas where family planning education should be concentrated, etc.
By visualizing such data, DHMTs have information that facilitates efforts to improve health system functioning, improves capabilities to plan essential services for pregnant and nursing mothers, infants and children. This enables managers to prioritize work, shape health care decisions and prevent excess morbidity/mortality and improve health system functionality. GIS can facilitate efforts to address the goal of implementing the WHO’s building block framework of “information for decision-making.” Experience emerging from our pilot attests to the need for sustaining implementation research on GIS and expanding the application of this technology in resource-poor settings throughout Africa.
References
- 1.Boulos M N K. (2004) Towards evidence-based, GIS-driven national spatial health information infrastructure and surveillance services in the United Kingdom. , Int J Health Geogr 3(1), 10-1186.
- 2.World Health Organization. (2007) Everybody’s Business -- Strengthening Health Systems to Improve Health Outcomes WHO’s Framework for Action. Geneva: World Health Organization;2007.
- 3.Ghana Statistical Service. (2014) Poverty Profile in Ghana (2005-2013): Ghana Living Standards Survey Round 6. , Accra, Ghana
- 4. (2015) Ghana Statistical Service. (GSS),Ghana Health Service(GHS) and II. Ghana Demographic and Health Survey2014 , Rockville, Maryland, USA .
- 5.Opare J K L, J K Awoonor-williams, J K Odoom, Awuni B, Juliana A. (2015) . Outbreak of Cholera in Vea-Gunga , Bongo District of the Upper East Region, Ghana Impact of Traditional Medicine and the National Health Insurance Scheme. Saudi J Med Pharm Sci 1(9), 9-14.
- 6.M N Adokiya, J K Awoonor-Williams, I Y Barau, Beiersman C, Mueller O. (2015) Evaluation of the integrated disease surveillance and response system for infectious diseases control in northern Ghana. , BMC Public 15(1), 10-1186.
- 7.Anto F, Asoala V, Adjuik M, Anyorigiya T, Oduro A. (2014) Childhood Activities and Schistosomiasis Infection in the Kassena-Nankana District of Northern Ghana. , J Infect Dis Ther 2(4), 10-4172.
- 8.Gbakima A A, Appawu M A, Dadzie S, Karikari C, Sackey S O. (2005) Lymphatic filariasis in Ghana: establishing the potential for an urban cycle of transmission. doi: 10.1111/j.1365-3156.2005.01389.x. Trop Med Int Heal.10(4):. 387-392.
- 9.Yahaya A, Alhassan N, Adam A. (2016) Epidermic of Potts Disease at the Upper East Region of Ghana. , Int J Humanit Soc Sci Educ 3(7), 26-30.
- 10.Asuo-Mante E, J K Awoonor-Williams, Yelifari L, Boyer C, M L Schmitt. (2016) . The Application of Geographic Information Systems (GIS) to Improving Health Systems in the Upper East Region of Ghana.http://jghcs.info/index.php/j/article/view/426. J Glob Heal Care Syst 6(1).
- 11.Heyen-Perschon J. (2005) Report on Current Situation in the Health Sector of Ghana and Possible Roles for Appropriate Transport Technology and Transport Related Communication Interventions.
- 12.Ghana Health Service. (2005) Community Health Planning and Services (CHPS): The Operational Policy. Ghana Health Service Policy Document No. 20 , Accra: Ghana Health Service .
- 13.Nyonator F, Ofosu A, Segbafah M, d’Almeida S. (2014) Monitoring and evaluating progress towards Universal Health Coverage. in Ghana. doi: 10.1371/journal.pmed.1001691. PLoS Med 11(9), 1001691.
- 14.Nyonator F K F, Awoonor-Williams J K J, Phillips J F J, Jones T C T, Miller R R A. (2005) The Ghana community-based health planning and services initiative for scaling up service delivery innovation. Health Policy Plan. 20(1), 25-34.
- 15.. Ministry of Health (MoH), and Ghana National Drugs Programme (GNDP).(2009)Assessment of Medicines Procurement and Supply Management Systems in the Public Health Sector- A Country Report2009 , Accra, Ghana .
- 16.Mutale W, Chintu N, Amoroso C, Awoonor-Williams K, Phillips J. (2013) Improving health information systems for decision making across five sub-Saharan African countries: Implementation strategies from the African Health Initiative. doi: 10.1186/1472-6963-13-S2-S9. BMC Health Serv Res. 13 Suppl 2(Suppl 2):S9.
- 17.Nyonator F, T C Jones, R A Miller, J F Phillips, Awoonor-Williams J K J. (2003) Guiding the Ghana Community-Based Health Planning and Services Approach to Scaling up with Qualitative Systems Appraisal. , Int Q Community Health Educ 23(3), 189-213.
- 18.Awoyemi T T, Obayelu O A, Opaluwa H I. (2011) . Effect of Distance on Utilization of Health Care Services in Rural Kogi State , Nigeria, J Hum Ecol 35(1), 1-9.
- 19.Buor D. (2002) Distance as a predominant factor in the utilisation of health services in the Kumasi metropolis. , Ghana. GeoJournal 56(2), 145-157.
Cited by (3)
- 1.Phillips James F., Awoonor-Williams John Koku, Bawah Ayaga A., Nimako Belinda Afriyie, Kanlisi Nicholas S., et al, 2018, What do you do with success? The science of scaling up a health systems strengthening intervention in Ghana, BMC Health Services Research, 18(1), 10.1186/s12913-018-3250-3
- 2.Asabere Nana Yaw, Lawson Gare, Badu-Marfo Godwin, Kwofie Lydia, Mensah Daniel Opoku, et al, 2021, Classification of Public Health Centres in Accra through a Web-Based Portal Integrated with Geographical Information System (GIS), Journal of Healthcare Engineering, 2021(), 1, 10.1155/2021/4178161
- 3.Asuo-Mante Eric, Mumuni Abdul-Jaleel, Asuo-Mante Myriam, Yelifari Lawrence, Awoonor-Williams John Koku, et al, 2017, A Pilot Trial of Applying Geographic Information System Technology to Health System Strengthening in the Upper East Region of Ghana, Journal of Medical Informatics and Decision Making, 1(1), 1, 10.14302/issn.2641-5526.jmid-17-1762