
Abstract
Discrimination of case-control status based on gene expression differences has potential to identify novel pathways relevant to neurodegenerative diseases including Parkinson’s disease (PD). In this paper we applied two different novel algorithms to predict dysregulated pathways of gene expression across several different regions of the brain in PD and controls. The Fisher’s ratio sampler uses the Fisher’s ratio of the most discriminatory genes as prior probability distribution to sample the genetic networks and their likelihood (accuracy) was established via Leave-One-Out-Cross Validation (LOOCV). The holdout sampler finds the minimum-scale signatures corresponding to different random holdouts, establishing their likelihood using the validation dataset in each holdout. Phenotype prediction problems have by genesis a very high underdetermined character. We used both approaches to sample different lists of genes that optimally discriminate PD from controls and subsequently used gene ontology to identify pathways affected by disease. Both algorithms identified common pathways of Insulin signaling, FOXA1 Transcription Factor Network, HIF-1 Signaling, p53 Signaling and Chromatin Regulation/Acetylation. This analysis provides new therapeutic targets to treat PD.
Author Contributions
Academic Editor: Qiang Cheng, Biomedical Informatics Institute, and Computer Science Department, China.
Checked for plagiarism: Yes
Review by: Single-blind
Copyright © 2019 Juan Luis Fernández-Martínez, et al.
 This is an open-access article distributed under the terms of the Creative Commons Attribution License, which permits unrestricted use, distribution, and reproduction in any medium, provided the original author and source are credited.
Competing interests
The authors have declared that no competing interests exist.
Citation:
Introduction
Parkinson’s disease (PD) is a common, age-related neurodegenerative disorder where lifetime risk of disease is determined by a mixture of genetic and non-genetic factors. Based on these nominated risk factors, several biological pathways have been suggested to be involved in the etiology of PD, including mitochondrial dysfunction and oxidative stress 1, 2, 3, 4, 5. However, the relationship between underlying risk factors and disease progression remains unclear. Both microarrays and associated bioinformatics analyses have been used previously to attempt to understand the genetic background in PD 6, 7, 8. However, the robustness of the bioinformatics methods that are used to analyze the gene dysregulation in PD remains uncertain, due to the inherently high underdetermined character of the phenotype prediction problems involved 9, 10. This problem not only affects the study of Parkinson's disease molecular mechanisms, but it is general, given the dramatic existing imbalance between the number of samples and the number of possible control variables (deregulated genes).
The analysis of biological pathways in different phenotypes via the analysis of genetic data is a complex problem due to the absence of a mathematically defined conceptual model to relate different genes to the phenotype. One solution to this problem is to construct a classifier, to discriminate genetic signatures between of classes in which the phenotype is divided, i.e., cases and controls, finding the set of discriminatory genes that separate both classes in an optimum way. However, as it has been previously outlined, phenotype prediction inherently has a high degree of under-determinacy, since the number of monitored genes is usually much greater than the number of samples used. In practice, it is important to rank genes according to their discriminatory power to predict phenotype, and to sample highly predictive networks expected to be involved in genetic pathways that explain the disease. Mathematically, such networks belong to the uncertainty space of the corresponding classifier used to discriminate the phenotype. The mathematical structure of the uncertainty space for linear and nonlinear inverse problems has been discussed previously 11, 12. For a given classifier the smallest-scale signature is the one that has the least number of discriminatory genes with the highest predictive accuracy. However, due to noise in the genetic data and class assignment, some of these highly discriminatory signatures might be incorrectly assigned 9, 10, 13 and not directly involved in relevant genetic pathways. Prior research suggested that the effect of noise in parameter identification problems (and classification problems are) is crucial 14, 15 and should be integrated in the appraisal of the solutions that are found, further implying that the discriminatory power of the most important genes related to the phenotype should be appraised using sampling methodologies. Bayesian networks can be used to discover relations between genes via a directed acyclic graph (see for instance 16, 17), nevertheless this method is computationally expensive and do not take fully into account the uncertainty of the corresponding phenotype prediction problem 18). Here, we compare two different novel algorithms to identify pathways in phenotype prediction problems showing its application to PD 18, 19. Mathematically, the Holdout sampler is also related to the data kit inversion procedure 20.
The structure of the paper is as follows: first we present the materials and methods, with special emphasis to the sampling methods that are used in this paper, and finally we present the main results and their discussion. Both sampling algorithms identified common defective (or deregulated) pathways in PD compared to healthy controls, including Insulin signaling, FOXA1 Transcription Factor, HIF-1 Signaling, p53 Signaling and Chromatin Regulation / Acetylation. We expect that the results provided by this analysis serve to find novel therapeutic targets and repositioning some existing drugs in order to reestablish homeostasis (see for instance 21).
Materials and Methods
The paper is based in a retrospective analysis of a gene expression data deposited in the GEO expression omnibus using the accession number GSE28894. Flash frozen brain samples were provided by the Queen Square Brain Bank for Neurological Disorders, UCL Institute of Neurology, UCL (London). The dataset contains 59 brain samples from healthy controls and 55 samples from patients with PD neuropathologically diagnosed according to Queen Square Brain Bank criteria. Gene expression was estimated across four regions of the brain, namely the cerebellum, medulla, striatum and cortex). Total RNA from the medulla (n=15 control brains, n=14 PD brains), striatum (n=15 control brains, n=15 PD brains), frontal cortex (n=15 control brains, n=11 PD brains) and cerebellum (n=14 control brains, n=15 PD brains) was extracted and hybridized to Illumina Human v2.0 expression microarrays.
The Fisher’s Random Sampler
The Fisher’s ratio sampler consists in sampling the defective pathways considering the discriminatory power of individual genes as measured by the Fisher’s ratio. The workflow corresponding to the FR sampler in shown in Figure 118. The algorithm is as follows:
Figure 1.Flow chart of the Fisher’s ratio sampler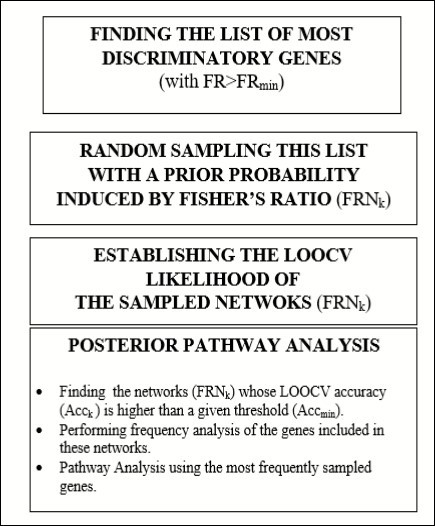
Finding the set of genes with the highest Fisher’s ratio within the set of genes with the highest fold change. For that purpose, we first found the genes that are differentially expressed in both tails (over and under-expressed) and ranking these genes by their Fisher’s ratio, that looks for genes that separate the classes further apart and are very homogeneous within classes (low intra-class variance). We define the set of discriminatory genes as those that are differentially expressed and have Fisher’s ratio greater than, fr = 0.8 since this value implies that the centers of the distribution in both classes are separated: .
This Fisher’s ratio cutoff value could be further decreased till fr = 0.5 if the number of discriminatory genes within this set is very low. Therefore, the Fisher’s ratio cut-off value is a tuning parameter of this procedure.
Finding the small-scale genetic signature. The most discriminatory genes are ranked them in decreasing order based on their discriminatory power and the algorithm finds the small-scale signature that optimally discriminates between classes by means of recursive feature elimination. The predictive accuracy estimation is based on Leave-One-Out-Cross-Validation (LOOCV) using a nearest neighbor classifier 9, 13, 22, 23. The small-scale signature gives an approximate idea of the typical length (number of genes) of the high discriminatory networks.
Random sampling of high discriminatory equivalent networks. The random sampler is able to find other networks of highly discriminatory genes, using a prior sampling probability of any individual gene proportional to its Fisher's ratio. Once a network is randomly built according to the Fisher’s probability distribution, its LOOCV predictive accuracy is established. This sampling follows the Bayes rule with a prior probability that depends on the Fisher’s ratio of the genes that have been selected and using a likelihood probability function that depends on the LOOCV predictive accuracy of this network.
Finally, considering the most discriminatory networks that have been sampled, which are those that explain the PD phenotype with a predictive accuracy higher than a minimum accuracy that it is given (typically higher than 85%), we establish the posterior sampling frequencies of the main prognostic genes involved in these networks. The biological pathways are established using Gene Analytics 24 using the set of genes with the highest sampling frequencies. The frequency cut-off is tuned in order to have enough discriminatory genes in the pathway analysis. This platform also provides important clues about the biological processes and the existence of chemical compounds to target the actionable genes.
The Holdout Random Sampler
Phenotype prediction problems can be viewed as a generalized regression between the sets of genes that characterize a given phenotype and a set of classes corresponding to a given set of samples that forms the training data set. A simple way of sampling the defective genetic pathways in phenotype prediction problems consists in performing different random holdout simulations and finding the minimum-size signature of high discriminatory genes for each holdout. It has been numerically shown that the holdout procedure in a simple linear regression problem serves to sample its region of uncertainty. This fact can be easily translated to the phenotype prediction problems.
The workflow corresponding to the holdout sampler is shown in Figure 219. The holdout sampler determines for each holdout the small-scale genetic signature in the training dataset (75% of the total data) and its predictive accuracy is established using the validation dataset (25% of the total dataset). Both datasets are randomly generated in each holdout. In this case, the posterior analysis is constructed taking into account all the small-scale genetic signatures with high predictive validation accuracy. As in the previous case, the posterior analysis of the minimum size signatures found in different bags with a validation predictive accuracy higher than a given minimum predictive accuracy (85%) serves to establish the defective genetic pathways, using ontological ready platforms. The application of this methodology to sampling the defective genetic pathways in Parkinson disease compared to healthy control serves to decipher the biological processes that are involved at the level of transcriptome. The knowledge that stems from this analysis should be crucial important in drug design to palliate the effects of PD and reestablishing the homeostasis perturbed by the disease.
Figure 2.Flow chart of the holdout sampler.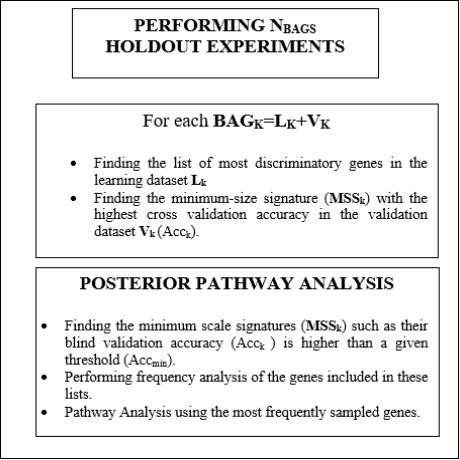
Results
Regarding the discriminatory power of the genes of the PD vs of the PD vs healthy control comparison, the maximum Fisher’s ratio is 1.36 for the gene GRHL1 and only 9 genes have a Fisher’s ratio greater or equal 1. The highest LOOCV predictive accuracy (90.35%) was obtained with the first 46 most discriminatory genes that have a Fisher’s ratio greater than 0.65. Additionally, considering only the six most discriminatory genes (GRHL1, SBDS, RPS4Y1, JARID1D and FAM29A and UNQ1940) we achieved a LOOCV predictive accuracy of 88.60%, close to the maximum accuracy obtained with 46 genes. Most of the discriminatory genes shown are more highly expressed in PD compared to controls (refer to Table 1).
Table 1. PD vs healthy control. We only show the list of most discriminatory genes with a Fisher’s ratio higher than 0.7. With bold-face the genes that are under-expressed in PD| Gene | Mean-HC | Std-HC | Mean-PD | Std-PD | FC | FR (log) | Accuracy |
| GRHL1 | 69.17 | 44.30 | 129.08 | 34.95 | -0.90 | 1.36 | 81.58 |
| SBDS | 1357.33 | 419.09 | 805.41 | 275.25 | 0.75 | 1.32 | 88.60 |
| RPS4Y1 | 1741.55 | 1962.49 | 2285.93 | 2089.89 | -0.39 | 1.28 | 88.60 |
| JARID1D | 247.70 | 278.03 | 294.63 | 265.35 | -0.25 | 1.10 | 87.72 |
| FAM29A | 33.98 | 15.08 | 17.55 | 10.35 | 0.95 | 1.09 | 87.72 |
| UNQ1940 | 8.95 | 13.48 | 26.14 | 12.42 | -1.55 | 1.03 | 88.60 |
| CD27 | 55.26 | 33.34 | 82.38 | 22.41 | -0.58 | 1.01 | 85.09 |
| GPR142 | 11.72 | 16.18 | 30.92 | 15.45 | -1.40 | 1.01 | 83.33 |
| LELP1 | 28.15 | 26.54 | 55.26 | 22.22 | -0.97 | 1.00 | 85.09 |
| FAM83C | 7.34 | 11.12 | 19.84 | 10.65 | -1.44 | 0.99 | 81.58 |
| ZNF710 | 22.19 | 14.85 | 38.31 | 11.11 | -0.79 | 0.96 | 81.58 |
| REPIN1 | 45.10 | 24.81 | 71.77 | 24.63 | -0.67 | 0.95 | 81.58 |
| DENND1C | 60.17 | 47.26 | 106.38 | 34.91 | -0.82 | 0.94 | 81.58 |
| SAMD7 | 15.60 | 15.47 | 29.18 | 10.06 | -0.90 | 0.93 | 80.70 |
| RASA4 | 22.84 | 20.19 | 43.92 | 20.36 | -0.94 | 0.92 | 80.70 |
| GHRH | 22.35 | 16.73 | 37.86 | 19.41 | -0.76 | 0.89 | 81.58 |
| DEFB125 | 25.46 | 21.15 | 52.18 | 21.60 | -1.04 | 0.88 | 81.58 |
| MAP4 | 13.65 | 11.37 | 24.36 | 9.55 | -0.84 | 0.84 | 81.58 |
| EGFL9 | 27.24 | 12.36 | 39.30 | 11.36 | -0.53 | 0.84 | 83.33 |
| NFIC | 60.89 | 20.86 | 83.81 | 20.54 | -0.46 | 0.83 | 81.58 |
| MPZL1 | 28.52 | 15.75 | 43.90 | 14.14 | -0.62 | 0.83 | 82.46 |
| PDPK1 | 50.71 | 34.19 | 106.08 | 50.77 | -1.06 | 0.82 | 82.46 |
| SPIN1 | 617.23 | 169.26 | 845.98 | 174.16 | -0.45 | 0.81 | 83.33 |
| PLAA | 170.82 | 41.24 | 123.89 | 28.71 | 0.46 | 0.78 | 83.33 |
| LOC731809 | 96.04 | 50.25 | 46.49 | 22.63 | 1.05 | 0.78 | 82.46 |
| C3ORF22 | 25.72 | 18.68 | 44.28 | 14.31 | -0.78 | 0.77 | 83.33 |
| ZMAT1 | 236.00 | 95.63 | 140.43 | 50.67 | 0.75 | 0.77 | 83.33 |
| AMY1C | 7945.65 | 2296.93 | 5977.53 | 2345.32 | 0.41 | 0.77 | 84.21 |
| FLJ16124 | 10.28 | 16.83 | 22.51 | 15.28 | -1.13 | 0.77 | 84.21 |
| NUT | 10.79 | 9.98 | 20.96 | 9.47 | -0.96 | 0.75 | 86.84 |
| XAGE1 | 25.99 | 16.94 | 39.75 | 15.65 | -0.61 | 0.73 | 85.09 |
| RXFP4 | 20.93 | 14.18 | 35.15 | 13.42 | -0.75 | 0.72 | 84.21 |
| NPFFR1 | 1.57 | 10.37 | 9.28 | 7.55 | -2.56 | 0.72 | 86.84 |
| AGPAT1 | 18.16 | 12.99 | 27.87 | 10.83 | -0.62 | 0.72 | 86.84 |
| C19ORF10 | 652.66 | 261.66 | 424.44 | 147.71 | 0.62 | 0.71 | 85.96 |
| SAR1A | 909.14 | 180.53 | 730.35 | 152.18 | 0.32 | 0.71 | 86.84 |
We next compared two algorithms for gene prioritization in order to establish the altered genetic pathways. Table 2 shows the list of most frequently sampled genes by the Fisher’s ratio sampler while Table 3 shows the list of most frequently sampled genes by the holdout sampler. The holdout sampler provides more genes with higher sampling frequencies than the FR sampler. It can be observed that most of the genes with sampling frequency higher than 1% in the FR list also belong to the holdout list. Table 3 shows the pathway analysis established using the list of genes with sampling frequency higher than 0.2 in both cases (Fisher’s ratio and Holdout samplers). Table 5, Table 6 provide the pathways with the corresponding scores given in Table 4 for both random samplers. Pathway analysis of the list of genes with sampling frequency higher than 0.2 identified Insulin Pathway, FOXA1 Transcription Factor Network, HIF-1 Signaling Pathway, Transcription-P53 Signaling Pathway and Chromatin Regulation / Acetylation pathway.
Table 2. Fisher’s ratio random sampler. Most discriminatory genes sampled in different networks for the healthy control vs PD phenotype (sampling frequency higher than 0.4%). We also provide the mean of the expression in each group, the fold change, the Fisher’s ratio and the sampling frequency. It can be observed that the genes with highest FR are overexpressed in PD. With bold-face the genes that are under-expressed in PD.| Gene | Mean-HC | Mean-PD | FC | FR | Frequency |
| RPS4Y1 | 1741.55 | 2285.93 | -0.39 | 1.28 | 1.4 |
| GRHL1 | 69.17 | 129.08 | -0.9 | 1.36 | 1.36 |
| JARID1D | 247.7 | 294.63 | -0.25 | 1.1 | 1.27 |
| SPIN1 | 617.23 | 845.98 | -0.45 | 0.81 | 1.25 |
| UNQ1940 | 8.95 | 26.14 | -1.55 | 1.03 | 1.21 |
| SBDS | 1357.33 | 805.41 | 0.75 | 1.32 | 1.21 |
| FAM29A | 33.98 | 17.55 | 0.95 | 1.09 | 1.14 |
| RASA4 | 22.84 | 43.92 | -0.94 | 0.92 | 1.08 |
| GPR142 | 11.72 | 30.92 | -1.4 | 1.01 | 1.06 |
| MPZL1 | 28.52 | 43.9 | -0.62 | 0.83 | 1.03 |
| GHRH | 22.35 | 37.86 | -0.76 | 0.89 | 0.99 |
| EGFL9 | 27.24 | 39.3 | -0.53 | 0.84 | 0.9 |
| CD27 | 55.26 | 82.38 | -0.58 | 1.01 | 0.88 |
| NFIC | 60.89 | 83.81 | -0.46 | 0.83 | 0.82 |
| DENND1C | 60.17 | 106.38 | -0.82 | 0.94 | 0.82 |
| LELP1 | 28.15 | 55.26 | -0.97 | 1 | 0.8 |
| PDPK1 | 50.71 | 106.08 | -1.06 | 0.82 | 0.8 |
| SAMD7 | 15.6 | 29.18 | -0.9 | 0.93 | 0.75 |
| ZNF710 | 22.19 | 38.31 | -0.79 | 0.96 | 0.71 |
| MAP4 | 13.65 | 24.36 | -0.84 | 0.84 | 0.69 |
| DEFB125 | 25.46 | 52.18 | -1.04 | 0.88 | 0.65 |
| C1ORF9 | 49.01 | 19.08 | 1.36 | 0.67 | 0.62 |
| REPIN1 | 45.1 | 71.77 | -0.67 | 0.95 | 0.6 |
| FAM83C | 7.34 | 19.84 | -1.44 | 0.99 | 0.58 |
| SAMD13 | 15.37 | 1.3 | 3.56 | 0.68 | 0.5 |
| PLAA | 170.82 | 123.89 | 0.46 | 0.78 | 0.5 |
| AMY1C | 142.7 | 94.67 | 0.59 | 0.44 | 0.47 |
| C19ORF10 | 652.66 | 424.44 | 0.62 | 0.71 | 0.45 |
| EIF1AY | 594.27 | 582.59 | 0.03 | 0.53 | 0.43 |
| PRKRA | 1597.69 | 1315.14 | 0.28 | 0.53 | 0.43 |
| Gene | Mean-HC | Mean-PD | FC | FR | Frequency |
| SBDS | 1357.33 | 805.41 | 0.75 | 1.32 | 2.74 |
| UNQ1940 | 8.95 | 26.14 | -1.55 | 1.03 | 2.68 |
| GRHL1 | 69.17 | 129.08 | -0.9 | 1.36 | 2.63 |
| FAM83C | 7.34 | 19.84 | -1.44 | 0.99 | 2.53 |
| GPR142 | 11.72 | 30.92 | -1.4 | 1.01 | 2.47 |
| FAM29A | 33.98 | 17.55 | 0.95 | 1.09 | 2.4 |
| ZNF710 | 22.19 | 38.31 | -0.79 | 0.96 | 2.21 |
| SAMD7 | 15.6 | 29.18 | -0.9 | 0.93 | 2.18 |
| CD27 | 55.26 | 82.38 | -0.58 | 1.01 | 2.14 |
| RPS4Y1 | 1741.55 | 2285.93 | -0.39 | 1.28 | 2.1 |
| LELP1 | 28.15 | 55.26 | -0.97 | 1 | 1.99 |
| REPIN1 | 45.1 | 71.77 | -0.67 | 0.95 | 1.89 |
| DEFB125 | 25.46 | 52.18 | -1.04 | 0.88 | 1.86 |
| SPIN1 | 617.23 | 845.98 | -0.45 | 0.81 | 1.8 |
| JARID1D | 247.7 | 294.63 | -0.25 | 1.1 | 1.78 |
| EGFL9 | 27.24 | 39.3 | -0.53 | 0.84 | 1.69 |
| DENND1C | 60.17 | 106.38 | -0.82 | 0.94 | 1.65 |
| RASA4 | 22.84 | 43.92 | -0.94 | 0.92 | 1.64 |
| PLAA | 170.82 | 123.89 | 0.46 | 0.78 | 1.63 |
| MAP4 | 13.65 | 24.36 | -0.84 | 0.84 | 1.62 |
| MPZL1 | 28.52 | 43.9 | -0.62 | 0.83 | 1.59 |
| PDPK1 | 50.71 | 106.08 | -1.06 | 0.82 | 1.56 |
| GHRH | 22.35 | 37.86 | -0.76 | 0.89 | 1.4 |
| LOC731809 | 96.04 | 46.49 | 1.05 | 0.78 | 1.28 |
| C3ORF22 | 25.72 | 44.28 | -0.78 | 0.77 | 1.27 |
| NFIC | 60.89 | 83.81 | -0.46 | 0.83 | 1.26 |
| C4BPB | 4.98 | 17.78 | -1.84 | 0.7 | 1.12 |
| ZMAT1 | 236 | 140.43 | 0.75 | 0.77 | 1.1 |
| C19ORF10 | 652.66 | 424.44 | 0.62 | 0.71 | 1.06 |
| FLJ16124 | 10.28 | 22.51 | -1.13 | 0.77 | 1.03 |
| Fisher’s ratio sampler | Holdout sampler | |
| Most-frequentlysampled genes(Sampling Frequency >1 %) | RPS4Y1, GRHL1, JARID1D, SPIN1, UNQ1940, SBDS, FAM29A, RASA4, GPR142, MPZL1. | SBDS, UNQ1940, GRHL1, FAM83C, GPR142, FAM29A, ZNF710, SAMD7, CD27, RPS4Y1, LELP1, REPIN1, DEFB125, SPIN1, JARID1D, EGFL9, DENND1C, RASA4, PLAA, MAP4, MPZL1, PDPK1, GHRH, LOC731809, C3ORF22, NFIC, C4BPB, ZMAT1, KIR2DL5A, C190RF10, FLJ16124. |
| Pathways | Insulin Pathway, FOXA1 Transcription Factor Network, B Cell Development Pathway, HIF-1 Signaling Pathway, Transcription-P53 Signaling Pathway, Protein Processing in Endoplasmic, MRNA Splicing - Major Pathway, Glypican 2 Network, RNA Polymerase II Transcription Termination, P53 Pathway, Cellular Senescence, Integration of Viral DNA Into Host Genomic DNA, Trk Receptor Signaling Mediated By PI3K and PLC-gamma, HIF-2-alpha Transcription Factor Network, NGF Pathway, Chromatin Regulation / Acetylation. | Natural Killer Cell Receptors, FOXA1 Transcription Factor Network, HIF-1 Signaling Pathway, Oncogene Induced Senescence, Regulation of TP53 Expression and Degradation, Aldosterone-regulated Sodium Reabsorption, Class I MHC Mediated Antigen Processing and Presentation, Insulin Pathway, FOXA2 and FOXA3 Transcription Factor Networks, Regulation of Activated PAK-2p34 by Proteasome Mediated Degradation, Chromatin Regulation / Acetylation, FBXW7 Mutants and NOTCH1 in Cancer, HIF1Alpha Pathway, Transcription-P53 Signaling Pathway, Immuno regulatory Interactions Between A Lymphoid and A Non-Lymphoid Cell. |
| Biological Processes | Negative Regulation of Oxidative Stress-induced intrinsic Apoptotic Signaling Pathway, Negative Regulation of Ubiquitin-protein Transferase activity, Release of Sequestered Calcium Ion into Cytosol, Bone Marrow development, Growth Hormone Secretion, Positive Regulation of Multicellular Organism Growth | Growth Hormone Secretion, Bone Marrow development, Positive Regulation of Multicellular Organism Growth, Cellular Response to Epidermal Growth factor Stimulus, |
| Compounds | Zebularine, Acnu. | Zebularine, Acnu, ACIPIMOX |
| 7.87 | Insulin Pathway |
| 7.87 | FOXA1 Transcription Factor Network |
| 7.05 | B Cell Development Pathways |
| 7.02 | HIF-1 Signaling Pathway |
| 6.97 | Transcription_P53 Signaling Pathway |
| 6.88 | Protein Processing in Endoplasmic Reticulum |
| 6.86 | MRNA Splicing - Major Pathway |
| 6.08 | Glypican 2 Network |
| 5.87 | RNA Polymerase II Transcription Termination |
| 5.82 | P53 Pathway (RnD) |
| 5.56 | Cellular Senescence |
| 5.50 | Integration of Viral DNA Into Host Genomic DNA |
| 5.37 | Trk Receptor Signaling Mediated By PI3K and PLC-gamma |
| 5.21 | HIF-2-alpha Transcription Factor Network |
| 5.16 | NGF Pathway |
| 5.12 | Chromatin Regulation / Acetylation |
| 5.08 | Cellular Response to Heat Stress |
| 5.05 | Calnexin/calreticulin Cycle |
| 5.05 | Signaling Events Mediated By TCPTP |
| 5.05 | Regulation of TP53 Expression and Degradation |
| 8.77 | Natural Killer Cell Receptors |
| 8.15 | FOXA1 Transcription Factor Network |
| 8.06 | Vasopressin-regulated Water Reabsorption |
| 7.85 | G-Beta Gamma Signaling |
| 7.55 | Ovarian Steroidogenesis |
| 7.36 | HIF-1 Signaling Pathway |
| 7.24 | Transcription_P53 Signaling Pathway |
| 6.99 | Integration of Energy Metabolism |
| 6.97 | Serotonin Receptor 4/6/7 and NR3C Signaling |
| 6.96 | T Cell Co-Signaling Pathway: Ligand-Receptor Interactions |
| 6.72 | Phospholipase D Signaling Pathway |
| 6.26 | Insulin Receptor Recycling |
| 6.18 | Bile Secretion |
| 5.71 | Cell Adhesion Molecules (CAMs) |
| 5.68 | G Alpha (s) Signalling Events |
| 5.55 | Oncogene Induced Senescence |
| 5.38 | Signal Transduction_PKA Signaling |
| 5.24 | Signaling Events Mediated By TCPTP |
| 5.24 | Regulation of TP53 Expression and Degradation |
| 5.24 | Articular Cartilage Extracellular Matrix Pathway |
Figure 3 shows the correlation tree corresponding to the 30 first most discriminatory genes using the Pearson correlation coefficient. The most differentially expressed gene (GRHL1) is positively correlated to NFIC, DEFB125, DENND1C, GPR142, CD47 and UNQ1940 that control its expression. The main sub-trees develop under GPR142 and DENND1C. DENND1C (DENN Domain Containing 1C) is a protein-coding gene. Among its related pathways are Vesicle-mediated transport. Clathrin-mediated endocytosis is a major mechanism for internalization of proteins and lipids.
Figure 3.Correlation network for Parkinson disease (PD) vs healthy controls (HC) discrimination.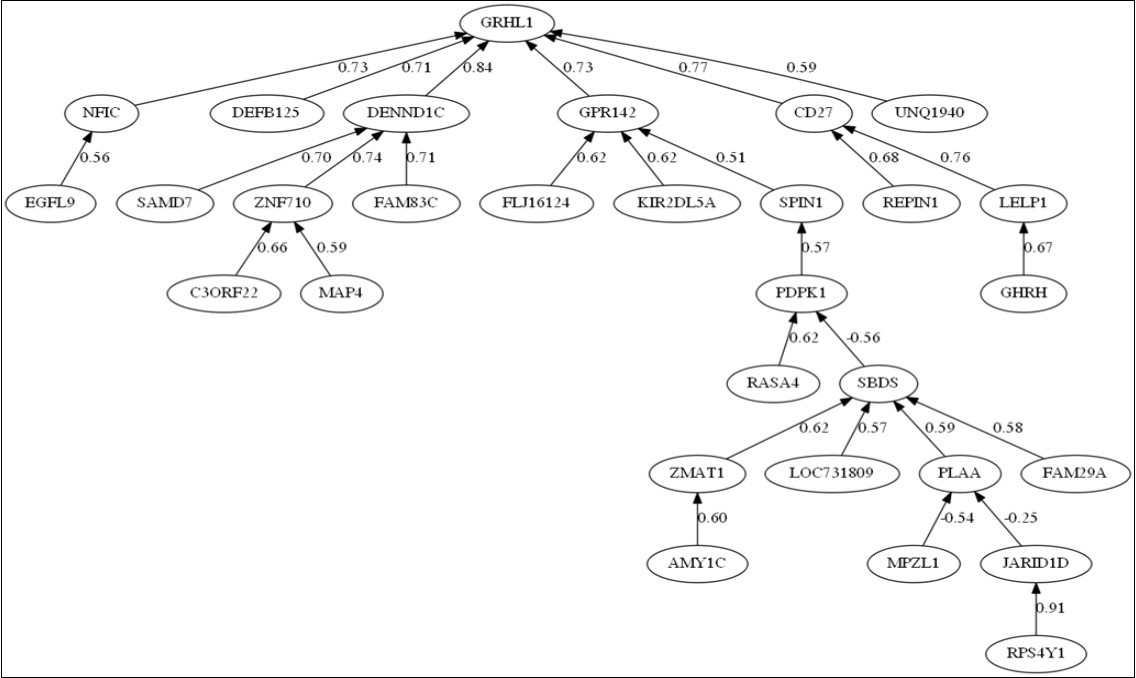
Discussion
Parkinson disease samples can be separated from healthy controls with a very high LOOCV predictive accuracy (close to 90%) using a minimum scale signature composed of 2 or 6 most discriminatory genes (GRHL1, SBDS, RPS4Y1, JARID1D, FAM29A and UNQ1940). Both sampling methods provide similar lists of the most-frequently sampled genes and also point to some common pathways (Insulin Pathway, FOXA1 Transcription Factor Network, HIF-1 Signaling Pathway, Transcription-P53 Signaling Pathway and Chromatin Regulation/Acetylation pathway) whose importance has been outlined by different research works in PD and neurodegenerative disorders. Riley et al (2014) using systems-based analyses of proteomic, RNAseq and microarrays data in different brain regions, finding as main mechanisms alterations in mitochondria and vesicular transport inducing defects in translation and protein turnover. Our results are slightly different and more general since our analysis integrates measures from different regions of the brain and it is performed depending on the class of the sample (PD or not).
Regarding the description of the most discriminatory genes of the PD vs HC phenotype, the following information is of interest: GRHL1 (Grainyhead Like Transcription Factor 1) is a protein-coding gene that plays an important role in the regulation of lipid metabolism by Peroxisome proliferator-activated receptor alpha (PPARalpha). This gene is very highly expressed in the kidney and it has been shown that the loss of GRHL1 influences the regulation of heart rate in a mouse model. In our study, this gene is overexpressed in PD patients with expression that almost double the level of expression in healthy patients. It has been found that GRHL1 (or LBP-32) is overexpressed in colorectal cancer at mRNA level and correlates with clinical staging 25. GRHL1 is also involved in colon cancer progression and metastasis acting as tumor suppressor in neuroblastoma 26. Up to our knowledge GRHL1 has never been associated to PD.
SBDS (Ribososme Maturation Factor) encodes a protein that plays an essential role in RNA metabolism and ribosome biogenesis. This gene is required for normal levels of protein synthesis, and it may play a role in cellular stress resistance, in cellular response to DNA damage, and in cell proliferation. The Shwachman-Diamond Syndrome is associated to SBDS. Knockdown of SBDS expression results inincreased apoptosis in erythroid cells undergoing differentiation due to elevated ROS levels. Hence, SBDS is critical for normal erythropoiesis27. Nevertheless, the role of the SBDS protein in RNA processing is not completely clear yet. In this analysis, this gene is under expressed in PD and it has never been associated to this disease.
RPS4Y1 (Ribosomal Protein S4, Y-Linked 1) is a protein-coding gene related to Viral mRNA Translation and Activation of the mRNA. Among its related pathways are Viral mRNA Translation and Activation of the mRNA and Influenza Viral RNA Transcription and Replication. This gene has been found to be related to PD by analysis of gene expression in whole blood 28. The mean expression of RPS4Y1 is lower in MCI (1066), compared to AD (1567), healthy controls (1741) and PD (2286). Therefore, this gene is differentially expressed in two neurodegenerative diseases, as it is over-expressed in PD and under-expressed in AD.
JARID1D (Lysine Demethylase 5D) encodes a protein containing zinc finger domains. It has been found to be a suppressor and prognostic marker of prostate cancer metastasis 29. JARID1D is overexpressed in PD (295) with respect to healthy controls (248). JARID1D is also one of the genes that serve to differentiate Mild Cognitive Impairment (244) from AD (281). Therefore, the expressions in these two neurodegenerative diseases (PD and AD) are similar.
FAM29A and UNQ1940 are not very well characterized genes. FAM29A (HAUS6) encodes a protein that plays a role in cell division. This gene is also under-expressed in PD.
FAM83C encodes a protein that may be involved in regulating MAPK signaling in cancer cells. GPR142 encodes a protein member of the rhodopsin family of G protein-coupled receptors. ZNF710 encodes the Zinc Finger Protein 710, which is related to Gene Expression Pathways. SAMD7 is a protein coding gene involved in Retinitis Pigmentosa.
CD27 is a member of the TNF-receptor superfamily, required for long-term maintenance of T cell immunity, and plays a key role in regulating B-cell activation and immunoglobulin synthesis. Most genes that better discriminate the PD from healthy controls have never been related to PD. Interestingly, some of these genes have been found to be also related to Alzheimer disease, which may suggest a common role in neurodegenerative disorders.
Concerning the Analysis of the Defective Pathways Found by Both Samplers:
1. Insulin resistance in PD was pointed by 30, proposing that disruptions in shared molecular networks lead to both. Besides the insulin signaling pathway may potentially be a novel target for disease modification 31.
2. Transcription factors FOXA1 and FOXA2 are crucial to maintain key cellular and functional features of dopaminergic neurons in the adult brain of mice. Transcription factors FOXA1/2 control dopaminergic neurons development, and retain their expression in adult neurons. Dopaminergic neurons are important in the brain control of voluntary movement and a variety of cognitive functions such as reward–motivation mechanisms, mood regulation, addiction and memory 32.
3. Hypoxia inducible factor-1 (HIF-1) is a transcriptional factor responsible for cellular and tissue adaption to low oxygen tension. Experimental and clinical evidence has demonstrated that regulating HIF-1 might ameliorate the cellular and tissue damage in the neurodegenerative diseases, and has suggested HIF-1 as a potential medicinal target for the neurodegenerative diseases 33.
4. The Transcription-P53 Signaling Pathway is very well-known in cancer. P53 activation is induced by a number of stress signals, including DNA damage, oxidative stress and activated oncogenes. The P53 protein is employed as a transcriptional activator of P53-regulated genes and has three major outputs: cell cycle arrest, cellular senescence and apoptosis. Alves da Costa and Checler (2011) suggested that the P53 Signaling Pathway is the missing link between the genetic and sporadic PD 34. It is known that this pathway plays an important role in neurodegenerative disorders 35. Park et al (2016) have shown that neurotoxins induce expression and acetylation of histones in cultured human cells and mouse midbrain dopaminergic neurons 36. Consistently, levels of histone acetylation are markedly higher in midbrain dopaminergic neurons of PD patients compared to those of their matched control individuals. This finding also reveals the importance of epigenetic mechanisms in the pathogenesis of PD.
5. Also, the list of pathways that are not common to both samplers includes: Class I MHC Mediated Antigen Processing and Presentation, Integration of Viral DNA into Host Genomic DNA, B Cell Development Pathway, Immuno-regulatory Interactions, Cellular Senescence and Oncogene Induced Senescence, among others. We believe that some of these mechanisms might be important and should be the subject for investigation of new therapeutic targets in PD.
Finally, regarding the most important biological processes, there are some common mechanisms involved depicted by both samplers: Bone Marrow development, Growth Hormone Secretion, Positive Regulation of Multicellular Organism Growth. Other biological mechanisms involved are: Negative Regulation of Oxidative Stress-induced intrinsic Apoptotic Signaling Pathway, Negative Regulation of Ubiquitin-protein Transferase activity. Most genes we found discriminative between PD and healthy controls have never been related to PD.
Conclusion
We have presented the comparison of two novel sampling algorithms of the defective pathways in Parkinson disease. Both methods look for the most discriminatory genes using a combination of fold change (differential expression) and Fisher’s discriminatory analysis (homogeneity within classes), and sample the uncertainty space of a Nearest neighbor classifier. The use of different sampling methods to analyze the deregulated pathways in different diseases in order to establish the defective pathways by consensus is crucial. This hypothesis of biological pathways invariance has been recently outlined in 37 concerning the analysis of the molecular mechanisms involved in the metastasis in triple negative breast cancer, and implies that the defective pathways should be independent of the sampling methods that are used to perform this analysis. We believe that the pathways identified in this retrospective analysis have been previously outlined by other research studies. We believe that might be the target for therapeutics and deserve future clinical validation. The incremental knowledge needed to solve complex neurodegenerative diseases such as PD, needs of the investigation of robust bioinformatic methods, such as those presented in this paper, to link the disease to its possible causes. In that sense, the non-free lunch theorem 38 also applies to bioinformatics, that is, no algorithm is superior to others when applied to a wide range of problems. In the present case, this sentence means that we should avoid the use of black box methodologies without a clear understanding of the biological basis of the phenotype problem that needs to be solved. Therefore, the solution does not simply consist in comparing the accuracy of the different algorithms, but establishing multidisciplinary teams able to tackle different aspects of these complex problems. Our expectation is that by publishing this paper in an Open-Access journal will serve to boost the research of this important neurodegenerative disorder.
Acknowledgements
We would like to R. Kumaran, Mark R Cookson and R. Bandopadhyay from the NIH-Laboratory of Neurogenetics at Bethesda and the UCL Institute of Neurology in London for making this dataset at disposal that allowed us to perform this retrospective analysis. The authors of this paper did not receive any funding to perform this research. Professor Fernández-Martínez wants to dedicate this paper to his close friend Manuel Prieto, professor of Geology at the University of Oviedo.
References
- 1.Lesage S, Brice A. (2009) Parkinson’s disease: From monogenic forms to genetic susceptibility factors. Human Molecular Genetics.
- 2.Klein C, Westenberger A. (2012) Genetics of Parkinson’s disease. Cold Spring Harb Perspect Med. 2(1), 008888.
- 4.Spatola M, Wider C. (2014) Genetics of Parkinson’s disease: the yield. Parkinsonism Relat Disord. 20, 35-38.
- 5.Kalinderi K, Bostantjopoulou S, Fidani L. (2016) The genetic background of Parkinson’s disease: current progress and future prospects. , Acta Neurol Scand 134(5), 314-26.
- 6.Miller R M, Federoff H J. (2006) Microarrays in Parkinson’s disease: a systematic approach. , NeuroRx 3(3), 319-26.
- 7.Cruz-Monteagudo M, Borges F, Paz-y-Miño C, MNDS Cordeiro, Rebelo I et al. (2016) Efficient and biologically relevant consensus strategy for Parkinson’s disease gene prioritization. , BMC Med Genomics 9(1), 12.
- 8.Feng Y, Wang X. (2017) Systematic analysis of microarray datasets to identify Parkinson’s disease-associated pathways and genes. Mol Med Rep. 15(3), 1252-62.
- 9.deAndrés-Galiana E J, Fernández-Martínez J L, Sonis S T. (2016) Sensitivity analysis of gene ranking methods in phenotype prediction. , J Biomed Inform 64.
- 10.Deandrés-Galiana E J, Fernández-Martínez J L, Saligan L N, Sonis S T. (2016) Impact of microarray preprocessing techniques in unraveling biological pathways. , J Comput Biol 23(12).
- 11.Fernandez Martinez JL, Fernandez Muniz MZ, Tompkins M J. (2012) On the topography of the cost functional in linear and nonlinear inverse problems. , Geophysics 77(1), 1.
- 12.Fernández-Martínez J L, Fernández-Muñiz Z, JLG Pallero, Pedruelo-González L M. (2013) From Thomas Bayes to Albert Tarantola. New insights to understand uncertainty in inverse problems from a deterministic point of view. Available from: http://linkinghub.elsevier.com/retrieve/pii/S0926985113001444 , J Appl Geophys [Internet] 98, 62-72.
- 13.Deandrés-Galiana E J, Fernández-Martínez J L, Sonis S T. (2016) Design of Biomedical Robots for Phenotype Prediction Problems. , J Comput Biol 23(8).
- 14.Fernández-martínez J L. (2014) The effect of noise and Tikhonov ’s regularization in inverse problems . Part I The linear case. J Appl Geophys [Internet].108(September): 176–85. Available from: http://dx.doi.org/10.1016/j.jappgeo.2014.05.006.
- 15.Fernández-Martínez J L, JLG Pallero, Fernández-Muñiz Z, Pedruelo-González L M. (2014) The effect of noise and Tikhonov’s regularization in inverse problems. Part II: The nonlinear case. , J Appl Geophys 108, 186-93.
- 16.Jiang X, Barmada M M, Visweswaran S. (2010) Identifying genetic interactions in genome-wide data using Bayesian networks. , Genet Epidemiol 34(6), 575-81.
- 17.Su C, Andrew A, Karagas M R, Borsuk M E. (2013) Using Bayesian networks to discover relations between genes, environment, and disease. , BioData Min 6(1), 6.
- 18.Cernea A, Fernández-Martínez J L, deAndrés-Galiana E J, Fernández-Ovies F J, Fernández-Muñiz Z et al. (2018) Sampling Defective Pathways in Phenotype Prediction Problems via the Fisher’s Ratio Sampler. Lect Notes Comput Sci (including Subser Lect Notes Artif Intell Lect Notes Bioinformatics) [Internet].10814LNBI: 15-23.
- 19.Fernández-Martínez J L, Cernea A, Fernández-Ovies F J, Fernández-Muñiz Z, Alvarez-Machancoses O et al. (2018) Sonis ST, others. Sampling defective pathways in phenotype prediction problems via the Holdout sampler. In: International Conference on Bioinformatics and Biomedical Engineering 24-32.
- 20.Fernández-Muñiz Z, Hassan K, Fernández-Martínez J L. (2019) Data kit inversion and uncertainty analysis. , J Appl Geophys
- 21.Gottlieb A, Stein G Y, Ruppin E, Sharan R. (2011) PREDICT: A method for inferring novel drug indications with application to personalized medicine. Mol Syst Biol.
- 22.Fernández-Martínez J L, deAndrés-Galiana E J, Sonis S T. (2017) Genomic data integration in chronic lymphocytic leukemia. J Gene Med.
- 23.Saligan L N, Fernández-Martínez J L, de Andrés-Galiana EJ, Sonis S. (2014) Supervised classification by filter methods and recursive feature elimination predicts risk of radiotherapy-related fatigue in patients with prostate cancer. , Cancer Inform 13, 141-52.
- 24.Stelzer G, Inger A, Olender T, Iny-Stein T, Dalah I et al. (2009) GeneDecks: paralog hunting and gene-set distillation with GeneCards annotation. Available from: http://www.ncbi.nlm.nih.gov/pubmed/20001862 , OMICS [Internet] 13(6), 477-87.
- 25.Mafune K, Ravikumar T S. (1992) Anti-sense RNA of 32-kDa laminin-binding protein inhibits attachment and invasion of a human colon carcinoma cell line. , J Surg Res 52(4), 340-6.
- 26.Fabian J, Lodrini M, Oehme I, Schier M C, Thole T M et al. (2014) GRHL1 acts as tumor suppressor in neuroblastoma and is negatively regulated by MYCN and HDAC3. Cancer Res. 74(9), 2604-16.
- 27.Sen S, Wang H, Nghiem C L, Zhou K, Yau J et al. (2011) The ribosome-related protein, SBDS, is critical for normal erythropoiesis. , Blood 118(24), 6407-17.
- 28.Sun A-G, Wang J, Shan Y-Z, Yu W-J, Li X et al. (2014) Identifying distinct candidate genes for early Parkinson’s disease by analysis of gene expression in whole blood. , Neuro Endocrinol Lett 35(5), 398-404.
- 29.Li N, Dhar S S, Chen T-Y, Kan P-Y, Wei Y et al. (2016) JARID1D is a suppressor and prognostic marker of prostate cancer invasion and metastasis. Cancer Res.
- 30.Santiago J A, Potashkin J A. (2013) Shared dysregulated pathways lead to Parkinson’s disease and diabetes. Trends Mol Med. 19(3), 176-86.
- 31.Athauda D, Foltynie T. (2016) Insulin resistance and Parkinson’s disease: A new target for disease modification? Prog Neurobiol. 145, 98-120.
- 32.Pristerà A, Lin W, Kaufmann A-K, Brimblecombe K R, Threlfell S et al. (2015) Transcription factors FOXA1 and FOXA2 maintain dopaminergic neuronal properties and control feeding behavior in adult mice. Proc Natl Acad Sci 112(35), 4929-4938.
- 33.Zhang Z, Yan J, Chang Y, ShiDu Yan S, Shi H. (2011) Hypoxia inducible factor-1 as a target for neurodegenerative diseases. , Curr Med Chem 18(28), 4335-43.
- 34.Da Costa CA, Checler F. (2011) Apoptosis in Parkinson’s disease: is p53 the missing link between genetic and sporadic Parkinsonism? Cell Signal. 23(6), 963-8.
- 35.Chang J R, Ghafouri M, Mukerjee R, Bagashev A, Chabrashvili T et al. (2012) Role of p53 in neurodegenerative diseases. , Neurodegener Dis 9(2), 68-80.
- 36.Park G, Tan J, Garcia G, Kang Y, Salvesen G et al. (2016) Regulation of histone acetylation by autophagy in Parkinson disease. , J Biol Chem 291(7), 3531-40.
- 37.Cernea A, J L Fernández-Martínez, E J deAndrés-Galiana, F J, Fernández-Muñiz Z et al. (2018) Comparison of different sampling algorithms for phenotype prediction. 6th International Work- Bioinformática IWBBIO 2018 (6th International Work-Conference on Bioinformatics and Biomedical Engineering. Springer International Publishing AG, part of Springer Nature 2018 (IWBBIO 2018), LNBI 10814 1-13.