
Abstract
In contributing to the initiative to address the COVID-19 pandemic and in order to enhance the knowledge on driving forces shaping the evolution of Severe Acute Respiratory Syndrome Coronavirus 2 (SARS-CoV-2) (isolated from Tunisian patients), a comparison in relation to other coronaviruses infecting humans (SARS-CoV-1, MERS-CoV, HCoV/229E, HCoV/NL63, HCoV/OC43, and HCoV/HKU1) as well as animals (SARS-CoVs in tiger, bats, civet, pangolin, bovine, and MERS-CoV in dromedary/camel), was conducted. In-depth analysis was carried out involving 115 sequences of spike glycoprotein-coding gene extracted from the international databases. Phylogeny inference allowed the reconstruction of a bifurcating tree where four distinct groups were delineated and at the same time, three animal accessions (SARS-CoV-2/tiger, MERS-CoV/camel, and SARS-CoV/bovine) shifted from the animal group and integrated the human coronaviruses clades. Nonetheless, in the presence of reticulate events such as recombination, networks described better the phylogenetic relationships rather than the classic dendrogram. Thus, networks were produced and identified four clusters containing sharply demarcated subgroups (eight subdivisions). Except networked phylogenies of SARS-CoV-1, SARS-CoV-2, and HCoV/HKU1, all the others showed edges and boxes illustrating the occurrence of incompatibilities related to the sequences of spike glycoprotein-coding gene. Thereby and consolidating this result, three methods (RDP package, GARD, and RECCO) were used to detect breakpoints in aligned sequences. Except the clades SARS-CoV-1 and SARS-CoV-2, all the remaining phylogenetic subdivisions were subject to recombination. Furthermore, the screening of selection pressure in all studied sequences by various statistics-based models of the HyPhy package, showed that, similarly, the lineages belonging to the clades SARS-CoV-1 and SARS-CoV-2 were not under selection. In contrast, all members of the remaining clades underwent, to different extents, adaptive selection as well as purifying selection.
Author Contributions
Academic Editor: Raul Isea, Fundación Instituto de Estudios Avanzados -IDEA, Venezuela
Checked for plagiarism: Yes
Review by: Single-blind
Copyright © 2021 Moncef Boulila
 This is an open-access article distributed under the terms of the Creative Commons Attribution License, which permits unrestricted use, distribution, and reproduction in any medium, provided the original author and source are credited.
Competing interests
The authors have declared that no competing interests exist.
Citation:
Introduction
Seven distinct zoonotic human coronaviruses described as spillovers since they crossed the species boundaries and jumped from animals to humans, are currently known. Four of them (HCoV-229E, HCoV-NL63, HCoV-OC43, and HCoV/HKU1) are responsible of the common cold ; whereas, the remaining three can cause from mild to severe respiratory diseases in humans i.e., SARS-CoV-1 (2003), MERS-CoV (2012), and recently SARS-CoV-2 (2019). Taxonomically, although HCoV-229E and HCoV-NL63 species are alpha-coronaviruses, HCoV-OC43, HCoV/HKU1, SARS-CoV-1, MERS-CoV, and SARS-CoV-2 species are beta-coronaviruses (subfamily orthocoronavirinae, family Coronaviridae, Order Nidovirales). Human coronaviruses have an unsegmented positive-sense single-stranded RNA genome with a size up to 32 Kbp and encoding for two polyproteins : pp1a and pp1ab, processed to produce 16 nonstructural proteins (nsp1 till nsp16) and four structural proteins (Spike (S), Envelope (E), Membrane (M), and Nucleoprotein (N)). In addition, a changing number of accessory proteins are also encoded by specific viruses 1. These proteins are critical to the viral life cycle and constitute candidates as targets for drug therapies. The SARS-CoV-2 S protein is highly conserved among all human coronaviruses 2. The S protein retains sufficient affinity to the cellular Angiotensin Converting Enzyme 2 (ACE2) protein, and likely uses ACE2 protein as a receptor for cellular entry. In fact, this oligomeric transmembrane protein mediates coronavirus entry into host cells. It contains two subunits S1 and S2. While S1 comprises a receptor-binding domain (RBD) that identify various host cell surface receptors, S2 includes basic elements necessary for membrane fusion. The coronavirus begins by binding to a receptor on the host cell using S1 subunit ; afterwards, it fuses viral and host membranes by the means of the subunit S2. Due to its compelling functions, it is regarded as one of the most important targets for COVID-19 vaccine and therapeutic research 3. It is worth noting that Nelson et al. 4 discovered a dynamically evolving novel overlapping gene as a factor in the SARS-CoV-2 pandemic : ORF3d, which was able to elicit a strong antibody response in COVID-19 patients. SARS-CoV-2 is spread among people through a droplet flying from an infected person’s mouth. The pandemic COVID-19, spread rapidly throughout the planet and resulted in devastating effects to the world’s economy and an ever-increasing number of fatalities. As of February 25, 2021, the website: https://www.worldometers.info/coronavirus/ reported 113, 100,859 confirmed cases, and 2,508,925 confirmed deaths. COVID-19 generates symptoms which could be classified in six categories : (i) flu-like without fever: headache, loss of smell, cough, sore throat and pain, but no fever ; (ii) flu-like with fever: similar to the previous group, plus loss of appetite and fever ; (iii) gastro-intestinal type: diarrhea, loss of smell and appetite, headache, sore throat, chest pain. Usually no cough ; (iv) fatigue type: fatigue, headache, loss of smell, cough, chest pain and fever. This group is considered more serious than the previous three, as 8.6% of them need respiratory support ; (v) confusion type: people experience confusion in addition to the symptoms listed in the fourth group. About 10% of them will need respiratory assistance ; (vi) abdominal and respiratory type: considered to be the most serious group, as almost half of people will need hospitalization and about a fifth will require respiratory assistance. Symptoms include headache, fever, loss of smell and appetite, cough, sore throat, chest pain, as well as shortness of breath, diarrhea and abdominal pain, muscle pain, confusion, and fatigue. Lately, as additional symptoms due to COVID-19, we heard about abnormalities in the frontal lobe of the brain, brain fog, pain in the eyes and even a rash in the mouth named « Covid tongue » noted recently. Unfortunately, the disease can leave sequelae such as respiratory problems, diabetes or problems in the heart, liver or kidney.
Nowadays, humans are facing a real threat represented by viruses which are characterized by a rapid evolution enabling them to escape from natural immunities and currently available and used medicines which could lead to many cases of death. To evolve, viruses take advantange of compacted genomes, huge population sizes and short generation times. Besides, high mutation rates, antagonistic epistasis, and extensive selection cofficients are additional assets contributing to their adaptation and survival. Evolution of viruses can be defined as the change with time of the frequency distribution of genetic variants or mutants in a population. The study of evolution points at exploring various driving forces that can shape the genetic structure of virus populations. Viruses can evolve under the influence of various mechanisms among which : (i) mutation (change in DNA or RNA sequence that creates a new allele : point mutation, insertion/deletion, reversion) ; (ii) reassortment (exchange of genetic material in segmented virus genomes due to a co-infection of a host by two or more viruses resulting in the shuffling of gene portions and generating progeny viruses with novel genome combinations) ; (iii) gene duplication : a genetic process, responsible for the genesis of novelty and redundancy, is considered as a major mechanism involved in the evolutionary history of different eucaryotes such as plants 5, where it plays an important role in escaping extinction 6, and bacteria 7. Conversely, streamlined viral genome generally possesses limited intergenic regions and numerous cases of overlapping open reading frames giving rise to a reduced genome size which undergoes strong selection. As a result, there is a low prevalence of gene duplication process in viruses particularly RNA viruses 8. Gene duplication contributes efficiently to evolution by providing new material for mutation, genetic drift, and selection 9 ; (iv) recombination is an important source of genetic variation for many RNA viruses. Most RNA viruses contain in their genome RNA-dependant RNA-polymerase (RdRp) which is error-prone due to lack of proofreading activity. Consequently, it is liable to create heterogenous populations of molecules (quasispecies) brought about by an accumulation of mutations that can be deleterious and damaging. Genetic recombination comes into repairing these errors with the help of other functional genes. Nagy and Simon 10 argued that there are three main types of recombination: similarity-essential, similarity-assisted, and similarity-nonessential. Furthermore, recombination process takes place according to a copy-choice model. During replication, the RdRp switches from the donor template to the acceptor template without releasing the nascent strand. Nevertheless, it is worth mentioning that, in contrast, several components of the Nidoviralesorder (to which Coronavirus genus is affiliated) possess a highly active and processive RNA polymerase complex whose 3’-5’ exoribonuclease implicated in RNA proofreading as a strong regulator of replication fidelity and diversity of coronaviruses 11 ; (v) natural selection evaluation is based on the comparison of nonsynonymous substitutions/ nonsynonymous site (dN) and synonymous substitutions/ synonymous site (dS). The estimation of the parameters dS, dN, and ω (dN/dS) is important in understanding of the dynamics of molecular sequence evolution. Because these numbers are normalized to the number of site, if selection was neutral (i.e., for a pseudogyne), the ratio dN/dS would be equal to 1. An unequivocal sign of positive selection is a dN/dS ratio significantly exceeding 1, indicating a functional benefit to diversify the amino acid sequence and change tends to be fixed. In contrast, if dN<dS, then the protein is kept as it is (negative selection) : deleterious mutations are eliminated by purifying selection 12.
In furthering our understanding on molecular evolution of the 2019 novel coronavirus(SARS-CoV-2), an in-depth investigation of main evolutionary forces that shape its genetic diversity, was conducted across the protein S-coding gene sequences. In addition, a comparison was made with other coronaviruses infecting humans as well as animals in order to explore possible relationships, if any, among all analyzed sequences.
Materials and Methods
Virus Source
A database of 115 spike glycoprotein-coding gene sequences comprised 15 sequences of each of SARS-CoV-1, SARS-CoV-2, MERS-CoV, HCoV-229E, HCoV-NL63, HCoV-OC43, and HCoV-HKU-1 coronavirus species infecting humans, and 10 accessions of other coronaviruses infecting animals (bats, civet, pangolin, tiger, bovine, dromedary/camel) were used in this study (Table 1). With regard to SARS-CoV-2, the sampling was based on nasopharyngeal swab from Tunisian travellers 13 who for many of them were at the origin of the spread of the virus and the outbreak of the epidemic in the country as well as from people permanently resident in Tunisia.
Table 1. Description of the reshuffled 115 coronavirus species accessions used in this study and their dispatching into clusters and subclusters as determined by inferred networked phylogenies produced by SplitTree4 software.| Host | Coronavirus species | Cluster | Subgroup | Country | Accession | |
| Homo sapiens | SARS-CoV-1 | Cluster I | Subgroup I | Canada | NC_004718 | |
| SARS-CoV-1 | Cluster I | Subgroup I | Germany | AY310120 | ||
| SARS-CoV-1 | Cluster I | Subgroup I | Germany | AY291315 | ||
| SARS-CoV-1 | Cluster I | Subgroup I | China | AP006561 | ||
| SARS-CoV-1 | Cluster I | Subgroup I | Taiwan | AY291451 | ||
| SARS-CoV-1 | Cluster I | Subgroup I | USA | MK062184 | ||
| MK062183 | ||||||
| MK062182 | ||||||
| MK062181 | ||||||
| MK062180 | ||||||
| MK062179 | ||||||
| JX163928 | ||||||
| JX163924 | ||||||
| KF514412 | ||||||
| SARS-CoV-2 | Cluster I | Subgoup II | Tunisia | MT955168 | ||
| MT955169 | ||||||
| MT955171 | ||||||
| MT955172 | ||||||
| MT955173 | ||||||
| MT955174 | ||||||
| MT559037 | ||||||
| MT499215 | ||||||
| MT499216 | ||||||
| MT499218 | ||||||
| MT499219 | ||||||
| MT499220 | ||||||
| Tiger | SARS-CoV-2 | Cluster I | Subgroup II | USA | MT365033 | |
| Bat | SARS-CoV/Bat RatG13 | Cluster I | Subgoup III | China | MN996532 | |
| SARS-CoV-HKU3-1 | Cluster I | Subgroup III | China | DQ022305 | ||
| SARS-CoV/ SL-CoV-ZC45 | Cluster I | Subgroup III | China | MG772933 | ||
| SARS-CoV/ SL-CoV-ZXC21 | Cluster I | Subgroup III | China | MG772934 | ||
| SARS-CoV/WIV1 | Cluster I | Subgroup III | China | KF367457 | ||
| Civet | SARS-CoV/A022 | Cluster I | Subgroup III | China | AY686863 | |
| Pangolin | SARS-CoV/PCOV_GX-P4L | Cluster I | Subgroup III | China | MT040333 | |
| Homo sapiens | SARS-CoV-1 | Cluster I | Subgroup III | China | AY508724 | |
| SARS-CoV-2 | Cluster I | Subgroup III | Tunisia | MT499217 | ||
| MT955170 | ||||||
| MT559038 | ||||||
| Homo sapiens | MERS-CoV. | Cluster II | None | Saudi Arabia | MG757605 | |
| MH013216 | ||||||
| MG011362 | ||||||
| Host | Coronavirus species | Cluster | Subgroup | Country | Accession | |
| Homo sapiens | MERS-CoV. | Cluster II | None | Saudi Arabia | MG011361 | |
| MG011360 | ||||||
| KU710264 | ||||||
| KU851859 | ||||||
| KT806053 | ||||||
| KT806048 | ||||||
| MG011344 | ||||||
| MG366483 | ||||||
| MG011341 | ||||||
| KX154684 | ||||||
| KT806047 | ||||||
| Homo sapiens | MERS-CoV. | Cluster II | None | Qatar | MN507638 | |
| Camel | MERS-CoV-Camel1-1 | Cluster II | None | Saudi Arabia | KF917527 | |
| Homo sapiens | HCoV-229E | Cluster III | Subgroup I | USA | KF514433 | |
| KF514432 | ||||||
| MN369046 | ||||||
| MN306046 | ||||||
| KY967357 | ||||||
| KY621348 | ||||||
| KY996417 | ||||||
| MT438700 | ||||||
| KY674919 | ||||||
| KF514431 | ||||||
| KY674914 | ||||||
| KF514429 | ||||||
| Homo sapiens | HCoV-229E | Cluster III | Subgroup I | Germany | NC_002645 | |
| AF304460 | ||||||
| Homo sapiens | HCoV-229E | Cluster III | Subgroup I | Italy | JX503061 | |
| 60896587376000Homo sapiens | HCoV-NL63 | Cluster III | Subgoup II | USA | KF530114 | |
| KF530113 | ||||||
| KF530112 | ||||||
| KF530111 | ||||||
| KF530110 | ||||||
| KF530109 | ||||||
| KF530107 | ||||||
| KF530106 | ||||||
| KF530105 | ||||||
| Homo sapiens | HCoV-NL63 | Cluster III | Subgroup II | China | MK334047 | |
| MK334046 | ||||||
| MK334044 | ||||||
| MK334043 | ||||||
| JX104161 | ||||||
| Homo sapiens | HCoV-NL63 | Cluster III | Subgroup II | South Korea | MG772808 | |
| Host | Coronavirus species | Cluster | Subgroup | Country | Accession | |
| Homo sapiens | HCoV-OC43 | Cluster IV | Subgroup I | USA | KF530099 | |
| KF530098 | ||||||
| KF530097 | ||||||
| KF530096 | ||||||
| KF530095 | ||||||
| KF530094 | ||||||
| KF530092 | ||||||
| KF530091 | ||||||
| KF530090 | ||||||
| KF530089 | ||||||
| KF530088 | ||||||
| KF530087 | ||||||
| KF530086 | ||||||
| KF530085 | ||||||
| Homo sapiens | HCoV-OC43 | Cluster IV | Subgroup I | Mexico | KX344031 | |
| Bovine | SARS-CoV/B-ENT | Cluster IV | Subgroup I | USA | NC_003045 | |
| Homo sapiens | HCoV-HKU1 | Cluster IV | Subgroup II | USA | KF430201 | |
| KF686346 | ||||||
| KF686344 | ||||||
| KF686343 | ||||||
| KF686342 | ||||||
| KF686341 | ||||||
| KF686340 | ||||||
| KY674943 | ||||||
| KY674942 | ||||||
| KY674941 | ||||||
| KY674921 | ||||||
| MK167038 | ||||||
| Homo sapiens | HCoV-HKU1 | Cluster IV | Subgroup II | China | NC_006577 | |
| AY597011 | ||||||
| Homo sapiens | HCoV-HKU1 | Cluster IV | Subgroup II | France | HM034837 | |
Multiple Alignment and Phylogenetic Relationships Among Coronaviruses Sequences
CLUSTAL X 2.1 14 software with default settings was used to conduct sequence multiple alignment. Phylogeny inference was carried out by the use of the algorithm Maximum Likelihood (ML) implemented in MEGA-X version 10.0.5 software 15. Based on the results obtained from best fit model test incorporated and conducted in MEGA-X, inferred phylogenetic relationships were achieved under the assumption of the substitution model GTR (General Time Reversible) coupled to a discrete Gamma distribution (+G) with five rate categories 16. The substitution model parameters estimated were (i) base frequencies: f(A) = 0.271; f(T) = 0.360; f(C) = 0.181; f(G) = 0.187, (ii) substitution rates: r(AT) = 0.074; r(AC) = 0.045; r(AG) = 0.094; r(TA) = 0.056; r(TC) = 0.131; r(TG) = 0.023; r(CA) = 0.067; r(CT) = 0.261; r(CG) = 0.036; r(GT) = 0.044; r(GA) = 0.135; r(GC) = 0.035, and (iii) transition/transversion ratios: R = 1.55. The Bayesian Information Criterion value (BIC = 102303.728) with GTR+G (+G = 1.25) model was the lowest among the 24 models tested. The branching of the tree was statistically evaluated using bootstrap analysis with 1,000 resamplings of the data. Moreover, in determining phylogenetic network inference, split neighborNet method, based on NJ distance method and incorrected P-distances algorithm contained in SplitsTree4 program 17, were used. Distance in the evolutionary concept is the smallest amount of evolution that could have occurred. Each changed base pair is considered as one change; whereas, all unchanged base pairs are counted zero.
Recombination Events Detection
In order to detect possible recombination signatures in all 115 accessions involved in this study, three different methods were utilized: RDP4.97 package, RECCO, and GARD. RDP4.97 package 18 put together a number of published recombination detection methods into a single set of tools: RDP 19, GENECONV 20, BOOTSCAN 21, MAXCHI 22, CHIMAERA 23, SISCAN 24, and 3SEQ 25. Although BOOTSCAN, RDP, and SISCAN are phylogeny-based methods, GENCONV, MAXCHI, CHIMAERA, and 3SEQ are substitution-based methods. In all cases, defaults variables were used. Moreover, these algorithms consider the sequences as linear and set statistical significance at a value of p < 0.05 with Bonferroni correction for multiple comparisons. Only events predicted by more than half of the methods are considered as significant. RECCO, the algorithm performed and developed by Maydt and Lengauer 26 as a fast, simple and sensitive method for detecting recombination in a collection of aligned sequences and locating potential recombination breaking points, is based on cost minimization. This method has only two tunable factors: recombination and mutation cost. In practice the only parameter considered is α, representing the cost of mutation relative to recombination. When α undergoes a change from 0 to 1, the cost of mutation weighted by α increases, and the cost for recombination weighted by 1- α decreases. More specifically, the element α controls the ambiguity between mutation and recombination. GARD (Genetic Algorithm for Recombination Detection) has the purpose to screen a multiple sequence analysis aiming at detecting recombination signals and inferring a unique evolutionary history for each determined block situated on the left and on the right sides of the breaking point 27, 28. Used as a basic component of GARD, the small-sample corrected Akaike Information Criterion (AICc) 29 is essential for breakpoint assignments score. Detected breakpoints are then evaluated for significance through KH test 30 of the HyPhy package 31.
Screening for Natural Selection
Seeking for selection signatures occurring in 115 sequences of spike glycoprotein-coding gene partitioned into clusters and subclusters, three approaches were explored : site, branch, and gene. Precisely, the first approach consisted of finding individual sites under positive/negative selection. Hence, four different methods i.e., the Single-Likelihood Ancestor Counting (SLAC), Fixed Effects Likelihood (FEL), Random Effects Likelihood (REL) 32, and Fast Unbiased Bayesian Approximation (FUBAR) 33 were utilized. They are codon-based maximum likelihood methods used to estimate dN/dS ratio at every codon in the alignment. In addition, Internal Fixed Effects Likelihood (IFEL), an appropriate model for investigating whether sequences sampled from a population were subject to selective constraints at the population level (i.e., along internal branches), as well as Mixed Effects Model of Episodic Selection (MEME) 34 aiming at looking for evidence of both diversifying, and importantly, episodic selection at individual sites, were also used. The second procedure comprised two methods: aBSREL, and GA-branch. The former model i.e., adaptive Branch-site Random Effects Likelihood (aBSREL) 35 was suited to test if positive selection occurred on a proportion of branches. In contrast, the latter i.e., GA-branch (Genetic Algorithm-branch) 36 is a codon-based genetic algorithm which can divide all branches of the phylogenetic tree setting out non-recombinant input into classes as stated by dN/dS ratio values. Various inferred models provided confidence intervals on dN/dS for each branch. The third process dealt with Branch-site Unrestricted Statistical Test for Episodic Diversification (BUSTED) whose principle was to provide a gene-wide test for positive selection and thus determine whether a gene underwent positive selection at at least one site on at least one branch. BUSTED utilized a codon model with three rate classes, constrained as ω1 ≤ ω2 ≤ 1 ≤ ω3. It involved two models namely unconstrained (alternative) and constrained (null hypothesis). If the null hypothesis is rejected, there is, subsequently, evidence that at least one site has experienced, at least some of the time, positive selection on the foreground branches 37. Last, the Partitioning Approach for Robust Inference of Selection (PARRIS) 38 enlarges classic codon-based likelihood ratio tests to reveal if a part of sites in the alignment underwent positive selection (ω ˃ 1). The model accomplished tests in three phases: (i) fitting an optimal model to estimate relative branch lengths, (ii) fitting the null hypothesis (M1) with three synonymous rate classes, and (iii) fitting the alternative model (M2) with three synonymous rate classes. It is worth mentioning that all selection algorithms used and previously indicated, were made available in the web server of HyPhy package implemented at http://www.datamonkey.org 39, 40, 41
Results
Maximum Likelihood Phylogenetic Tree and Networks
The Maximum Likelihood (ML) algorithm incorporated in MEGA-X software allowed the reconstruction of a phylogenetic tree where 115 spike glycoprotein-coding gene sequences were split into four distinct groups (Figure 1). Although, group I comprised three components (SARS-CoV-1, SARS-CoV-2, and SARS-CoVs infecting exclusively animals), group II encompassed all MERS-CoV lineages, group III gathered all human coronaviruses lineages of the species HCoV/OC43, and HCoV/HKU1, and finally group IV which was formed by all human coronaviruses lineages of the species HCoV/229E, and HCoV/NL63. It is worthwhile to note that three members of the animals SARS-CoVs have integrated the human coronaviruses clusters. It is indeed about SARS-CoV-2/tiger lineage which became member of human SARS-CoV-2 species cluster. Similarly, MERS-CoV/dromedary-camel became a component of MERS-CoV species clade, and finally SARS-CoV/bovine which was part of HCoV/OC43 species group. Howbeit, phylogeny inference and its significance, using ML algorithm implemented in MEGA-X software, may become poorly relevant if reticulate events (recombination, lateral gene transfer, gene duplication, reassortment) take place. For this reason, network phylogeny inference, highlighting the presence of conflicting signals and expressing the real phylogenetic relationships among all coronaviruses lineages used in this study, was adopted as shown in Figure 2. Herein, the produced network, using SplitTree4 software, showed almost the same topology with, however, a few differences which were twofold: (i) a clear-cut delineation of subgroups within the respective clusters. Each subgroup contained specifically all lineages of a distinct coronavirus species (including the new integrated animal lineage) as mentioned above and shown in Figure 1, (ii) a reshuffling of group I. Indeed, in subgroup I, the accession AY508724 was no longer member of SARS-CoV-1 species and moved to subgroup III becoming part of it. In similar fashion, the Tunisian accessions MT499217, MT955170, and MT559038 of SARS-CoV-2 species (subgroup II) shifted to subgroup III (Figure 2, Table 1). More explicitly and in furthering networked phylogenetic relationships among members of each identified subcluster, various analyses using SplitTree4 software, were carried out. Five out of eight coronavirus species groupings (i.e., reshuffled animal SARS-CoVs, MERS-CoV, HCoV-229E, HCoV-NL63, and HCoV-OC43 subgroups), showed network topologies containing conflicting signals represented by boxes and edges. Regarding animals SARS-CoVs subgroup, networked phylogenetic relationships showed that 11 accessions fell into seven different clades. Interestingly, three Tunisian SARS-CoV-2 lineages (MT559038, MT499217, and MT955170) were much closer to SARS-CoV/bat RatG13 (MN996532), and to SARS-CoV/pangolin (MT040333) than to any other SARS-CoV/bat lineages (MG772933, MG772934, DQ022305, and KF367457) nor civet lineage (AY686863) either. Likewise, the shifted lineage of SARS-CoV-1 (AY508724), although it was genetically close to civet lineage, it remained distant from all the other aforementioned (Figure 3). Concerning MERS-CoV lineages, they, phylogenetically, split into eight distinct clades. In addition, the Qatari accession (MN507638) wasn’t so different since it joined other MERS-CoV lineages from Saudi Arabia and formed a homogenous phylogroup (Group II). Seemingly, this group was less impacted by the reticulate factors effects compared to all other groups as shown by the absence of conflicting signals (boxes). Furthermore, the MERS-CoV lineage (KF917527) isolated from camel formed alone a distinct phylogroup (group V) (Figure 4). Referring to HCoV-229E species, two major clades differing geographically, were set out. There was indeed on the one hand, the German accessions (NC_002645, and AF304460) and on the other hand, the American ones distributed in six distinct groups. Besides, the depicted network showed heavy incompatibilites with a noticeable acuity in the USA cluster (Figure 5). With respect to HCoV/NL63 species, inferred networked phylogeny described three major groups and their split-up was overly controlled by the geographic origin of the sampled lineages particularly those belonging to the groups I (from USA) and II (from China) albeit the third group contained lineages from both regions as well as from South Korea. In addition and notoriously, the conflicting signals have spread along the whole network (Figure 6). As regards and analogously, 16 accessions of HCoV-OC43 species segregated into four distinct clades and their split-up was somewhat under the influence of the geographic origin of the lineages. In fact, the Mexican lineage was detached from the American ones as it was even more the lineage SARS-CoV/bovine (Group II) which was completely apart. It is noteworthy that striking reticulations congregated in the network extending from group I to group IV (Figure 7).
Figure 1.The circle form of a phylogenetic tree produced by the maximum likelihood algorithm under assumption of the general-time reversible (GTR) substitution model coupled to a discrete gamma distribution (+G) option of MEGAX software 15. Four major groups were delineated. The numbers above the branches indicate the bootstrap confidence value. The scale bar shows the number of substitution per nucleotide. Thick black lines indicate the demarcation line between phylogenetic groups. Double headed-arrows show the demarcation line between coronavirus species groups. Single headed-arrows represent the animal coronavirus species having shifted and integrated the human coronavirus phylogroups.
Figure 2.Networked phylogenetic relationships among 115 coronavirus species accessions which split into four clear-cut distinct clusters subdivided into subgroups (except cluster II).
Figure 3.NeighborNet for 11 sequences of spike glycoprotein-coding gene of assembled coronaviruses lineages of SARS-CoV-1, SARS-CoV-2, and animal SARS-CoVs belonging to cluster I (subgroup III). The networked relationships indicate the presence of reticulate events. Boxes imply likelihood of recombination. The phylogenetic network constructed, using SplitsTree4 software, delineated seven distinct clusters. The scale bar shows the number of substitution per nucleotide.
Figure 4.NeighborNet for 16 sequences of spike glycoprotein-coding gene of coronaviruses lineages of MERS/CoV belonging to cluster II. The networked relationships indicate the presence of reticulate events. Boxes imply likelihood of recombination. The phylogenetic network, constructed, using SplitsTree4 software, delineated eight distinct clusters. The scale bar shows the number of substitution per nucleotide.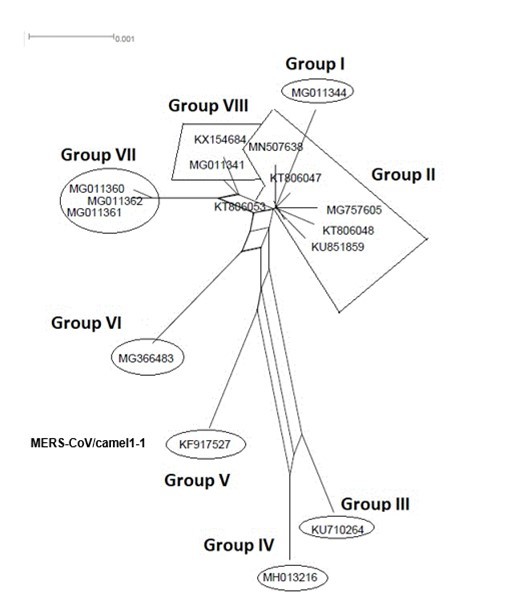
Figure 5.NeighborNet for 15 sequences of spike glycoprotein-coding gene of coronaviruses lineages of HcoV/229E belonging to cluster III (subgroup I). The networked relationships indicate the presence of reticulate events. Boxes imply likelihood of recombination. The phylogenetic network constructed, using SplitsTree4 software, delineated seven distinct clusters. The scale bar shows the number of substitution per nucleotide.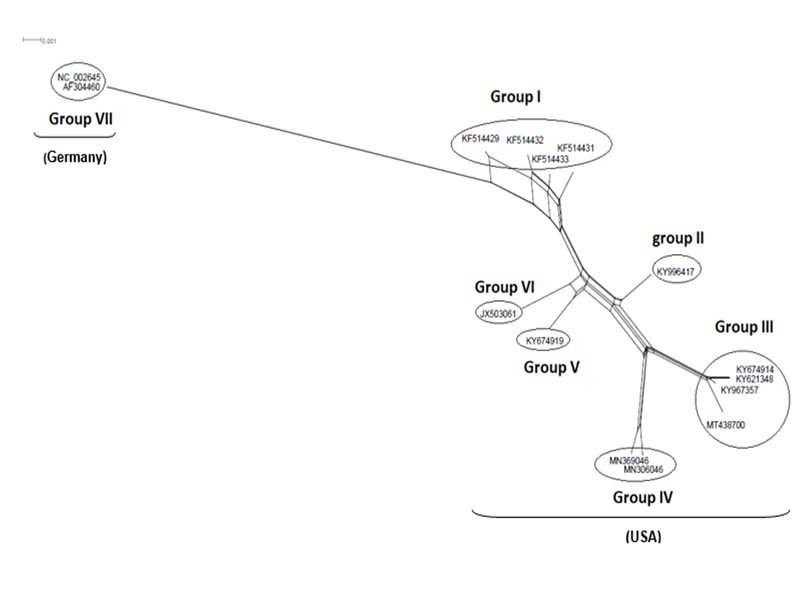
Figure 6.NeighborNet for 15 sequences of spike glycoprotein-coding gene of coronaviruses lineages of HCoV/NL63 belonging to cluster III (subgroup II). The networked relationships indicate the presence of reticulate events. Boxes imply likelihood of recombination. The phylogenetic network constructed, using SplitsTree4 software, delineated seven distinct clusters. The scale bar shows the number of substitution per nucleotide.
Figure 7.NeighborNet for 16 sequences of spike glycoprotein-coding gene of coronaviruses lineages of HCoV/OC43 belonging to cluster IV (subgroup I). The networked relationships indicate the presence of reticulate events. Boxes imply likelihood of recombination. The phylogenetic network constructed, using SplitsTree4 software, delineated seven distinct clusters. The scale bar shows the number of substitution per nucleotide.
Pairwise Nucleotide Identity Comparison.
Pairwise nucleotide identity comparison among 115 sequences subdivided in clusters and subclusters (eight subdivisions) (according to NeighborNet phylogeny inference performed in SplitTree4 software) of spike glycoprotein-coding gene of coronavirusspecies infecting humans (SARS-CoV-1, SARS-CoV-2, MERS-CoV, HCoV/229E, HCoV/NL63, HCoV/OC43, and HCoV/HKU1) and a mixed group containing various species of animals particularly bat, civet, camel, pangolin, tiger, and bovine, was carried out and the analyses resulted in the following percentage intervals : 89.99-100.00, 99.86-100.00, 26.76-99.92, 99.40-99.97, 40.35-100.00, 35.22-99.97, 31.12-100.00, and 54.47-100.00 ; and the number of most distant and closest couple of accessions were as follows : 9-16, 1-15, 1-1, 2-3, 4-2, 1-3, 4-2, and 1-4, for members of the subgroups I, II, and III (cluster I), cluster II, subgroups I, and II (cluster III), and subgroups I, and II (cluster IV), respectively (Table 1S). From this analysis, it emerged that the sequences of the lineages belonging to Subgroups I, and II (Cluster I), and Cluster II, were highly similar. In contrast, a lower similarity was observed in the sequences of the lineages affiliated to the subgroups I, and II of the clusters III, and IV. Undoubtedly, the mixed group (subgroup III, cluster I) comprising heterogenous members, showed the lowest similarity in the sequences of spike glycoprotein-coding gene.
Substitution Patterns
Although mutations are changes in nucleotide sequences due to errors in replication or repair, substitutions are mutations that have passed through the filter of selection. Substitution often involve amino acids with similar chemical characteristics supporting two evolutionary principles : (i) mutations are rare events, (ii) most dramatic changes are removed by natural selection. The analysis of both number and the type of substitutions, that have occurred during the evolution, are of central importance for the study of molecular evolution. In determining the substitution pattern and rates in the sequence of spke glycoprotein-coding gene of 115 lineages studied here, a substitution matrix was estimated for each type of subdivision as described earlier. Accordingly, it was revealed for subgroup I (cluster I) that rates of different transitional substitutions oscillated from 11.87 to 18.75; while, rates of transversional substitutions ranged from 3.76 to 5.93. Regarding subgroup II (cluster I), rates of transitional substitutions varied from 10.96 to 18.42 ; whereas, rates of transversional substitutions spanned from 3.85 to 6.46. Concerning subgroup III (cluster I), although rates of transitional substitutions extended from 9.51 to 26.03, rates of transversional substitutions fluctuated from 2.77 to 8.10. With regard to cluster II, whilst the span of rates of transitional substitutions ranged from 4.92 to 43.28, that of rates of transversional substitutions varied from 1.78 to 3.14. With respect to subgroup I (cluster III), as the extent of rates of transitional substitutions was from 7.12 to 36.08, that of rates of transversional substitutions was from 2.65 to 5.13. As regards, in subgroup II (cluster III), the expanse of rates of transitional substitutions was from 7.51 to 45.11, that of rates of transversional substitutions was from 1.46 to 3.31. Relating to subgroup I (cluster IV), rates of transitional substitutions oscillated from 6.49 to 39.25 ; while, rates of transversional substitutions fluctuated from 2.19 to 4.86. Referring to subgroup II (cluster IV), rates of transitional substitutions expanded from 9.77 to 28.64; whereas, rates of transversional substitutions ranged from 2.37 to 6.94 (Table 2). Therefore, it came out from this analysis that the highest rate of transitional substitutions regarded the residues T and C had a peack of 45.11 (subgroup II, cluster III). In contrast, the lowest rate of transitional substitutions concerned the residues G and A, had a downward peak of 4.92 (cluster II). On the other hand, the highest rate of transversional substitutions related to the residues T and A, culminated at 8.10 (subgroup III, cluster I). In opposition, the lowest rate of transversional substitutions dealt with the residues C and A, and C and G having the value of 1.46 (subgroup II, cluster III) (Table 2).
Table 2. Description of Maximum Likelihood estimate of the pattern of nucleotide substitution in the spike glycoprotein-coding gene of 115 coronavirus species lineages phylogenetically split into clusters and subclusters. Each entry is the probability of substitution from one base (row) to another base (column). Rates of different transitional substitutions are shown in bold and those of transversional substitutions are shown in italics. The analyses were conducted in MEGA-X software.| Phylogroup | Subgroup | Nucleotide substitution matrix | ||||
| Residue | A | T | C | G | ||
| Cluster I | Subgroup I | A | - | 5.93 | 3.76 | 11.87 |
| T | 5.93 | - | 11.87 | 3.76 | ||
| C | 5.93 | 18.75 | - | 3.76 | ||
| G | 18.75 | 5.93 | 3 . 76 | - | ||
| Subgroup II | A | - | 6.46 | 3.85 | 10.96 | |
| T | 6.46 | - | 10.96 | 3.85 | ||
| C | 6.46 | 18.42 | - | 3.85 | ||
| G | 18.42 | 6.46 | 3.85 | - | ||
| Subgroup III | A | - | 8.10 | 3.60 | 9.51 | |
| T | 7.11 | - | 15.49 | 1.57 | ||
| C | 5.32 | 26.03 | - | 2.79 | ||
| G | 14.79 | 2.77 | 2.94 | - | ||
| Cluster II | None | A | - | 3.14 | 1.96 | 4.92 |
| T | 2.31 | - | 27.04 | 1.78 | ||
| C | 2.31 | 43.28 | - | 1.78 | ||
| G | 6.38 | 3.14 | 1.96 | - | ||
| Cluster III | Subgroup I | A | - | 5.13 | 2.65 | 7.12 |
| T | 3.79 | - | 18.63 | 2.96 | ||
| C | 3.79 | 36.08 | - | 2.96 | ||
| G | 9.11 | 5.13 | 2.65 | - | ||
| Subgroup II | A | - | 3.31 | 1.46 | 7.51 | |
| T | 2.17 | - | 19.85 | 1.55 | ||
| C | 2.17 | 45.11 | - | 1.55 | ||
| G | 10.53 | 3.31 | 1.46 | - | ||
| Cluster IV | Subgroup I | A | - | 4.86 | 2.19 | 6.49 |
| T | 3.86 | - | 17.66 | 2.62 | ||
| C | 3.86 | 39.25 | - | 2.62 | ||
| G | 9.55 | 4.86 | 2.19 | - | ||
| Subgroup II | A | - | 6.94 | 2.37 | 11.24 | |
| T | 4.29 | - | 9.77 | 2.72 | ||
| C | 4.29 | 28.64 | - | 2.72 | ||
| G | 17.70 | 6.94 | 2.37 | - | ||
Detection of Potentially Recombining Coronaviruses
Generally, recombination is consisting of an exchange of genetic material in segmented as well as in unsegmented virus genome. It allows the virus to acquire new traits. In order to obtain reliable and relevant results, three bioinformatics methods were used : RDP package, RECCO, and GARD. The objective of the use of RDP package version 4.97 was threefold : (i) to identify the recombinant coronaviruses, (ii) to determine the different site recombination locations, (iii) to recognize the potential parentals. Accordingly, seven lineages having the accession numbers: KF530112, from USA, MK334043, MK334044, MK334046, MK334047 and JX104161, from China, and MG772808, from South Korea belonging to the coronavirus species HCoV/NL63, were recombinants ; the number of recombination sites were as follows : 5, 5, 3, 2, 3, 4, and 4, respectively. Furthermore, there was no geographical impediment with regard to the donor of genetic material. In other words, both major and minor parents could have any geographical origin (Table 3). Besides, only one lineage of HCoV/HKU1 species from USA was recombinant: MK167038 and only two recombination sites were detected. Here too, the geographical origin (USA or China) of the donors did not also constitute a restraint whatsoever (Table 3). Last, RDP package permitted the detection of breakpoints in the sequences of three coronaviruses infecting bat affiliated to cluster I (subgroup III) : SARS-CoV/SL-CoV-ZC45 (MG772933), SARS-CoV/SL-CoV-ZXC21 (MG772934), and SARS-CoV/HKU3-1 (DQ022305). Although the former two underwent recombination in four distinct sites, the latter recombined in only two sites. It was pointed out also that, in the vast majority, both major and minor parents had intraspecies origins. However and interestingly, the Tunisian SARS-CoV-2 lineage MT499217 was a possible donor (major parent) of genetic material for the bat lineages : SARS-CoV/SL-CoV-ZC45 (MG772933), and SARS-CoV/SL-CoV-ZXC21 (MG772934) (Table 3). This possibility was not so surprising since the genetic connection between SARS-CoV-2 and coronaviruses infecting bats was established by the phylogenetic relationships among lineages of cluster I (subgroup III) as shown in Figure 3 and reported elsewhere 42. Still, this observation needs to be ascertained by undertaking further analyses involving other genes constituting the SARS-CoV-2 genome in relation to SARS-CoV/bat genome. In contrast, RECCO algorithm demonstrated that only two and different coronaviruses species infecting bats i.e., SARS-CoV/HKU3-1 (DQ022305), and SARS-CoV/WIV1 (KF367457), were recombinants. Likewise, there was an additional recombinant: SARS-CoV/PCOV_GX-P4L isolated from pangolin (Figure 8a). Whereas the former lineage recombined in 23 sites, most of them (9) had a size as long as three residues, the latter two possessed nine and 14 breaking points, most of them (5 and 8), were 17 and 57 residues long, respectively (Table 2S). On the other hand, RECCO was able to detect recombination signals in the sequences of representatives of human coronaviruses : HCoV/229E (2 isolates) (Figure 8b), HCoV/NL63 (5 isolates) (Figure 8c), HCoV/OC43 (1 isolate) (Figure 8d), and HCoV/HKU1 (1 isolate) (Figure 8e). Furthermore, RECCO pointed out that in most cases, the size of the swapped segment exceeded three residues reaching even a size of 1,001 residues for the lineage MK334044 of the species HCoV/NL63. As regards, GARD and despite the fact that it wasn’t able to identify precisely which accession was recombinant by contrast to RDP4.97 and RECCO, it dealt with codon-based alignment and succeeded in placing breakpoints in various positions in the sequences. As a matter of fact and based on statistics, GARD determined 3, 1, 4, 5, 5, and 6 breaking points in aligned sequences of cluster I (subgroup III), cluster II, cluster III (subgroups I, and II), and cluster IV (subgroups I, and II), respectively (Table 4). Moreover and based on the use of Kishino-Hasegawa test (KH test) for significance estimation, it compared phylogenies constructed on both sides of the breakpoints and demonstrated that the topology was incongruent (significance at p = 0.1, p = 0.05, and p = 0.01) at the positions : 206 cluster I (subgroup III), 1049 and 2260 cluster III (subgroups I and II respectively) ,448 cluster IV (subgroup I), and 1677, and 2136 cluster IV (subgroup II) in aligned sequences of different lineages (Table 4). It is worth mentioning that while significant topological incongruence denotes that different tree topologies took place between portions delimited by recombination breakpoints, KH-insignificant breakpoints arise most frequently due variation in branch lengths among fragments. This could be due to some processes of recombination or to other activities such as spatial rate variation, heterotachy, etc. Finally and by way of conclusion, all three statistics-based methods used in this study (RDP package, RECCO, and GARD) failed to detect any recombination event in the sequences of Severe Acute Respiratory Syndrome coronaviruses 1 and 2 (SARS-CoV-1 and SARS-CoV-2).
Table 3. Determination of inferred recombination events in aligned 115 Spike glycoprotein-coding gene sequences of human and animal coronaviruses. The suite of recombination detection programs used for the detection of recombination events and the corresponding average p-values for each event were: R, RDP; G, GenConv; B, Bootscan; M, MaxChi; C, Chimaera; S, Siscan; 3S, 3SEQ. ‘Minor’ and ‘Major’ parents refer to the parental isolates contributing the smaller and larger fractions of the recombinant’s sequence, respectively; - no recombination event detected. Underlined accession in bold: Tunisian accession of SARS-CoV-2 as a putative donor.| Recombination pattern | p-value | ||||||||||||||||||||||||||
| Host | Coronavirusspecies | RecombinantIsolate(accession #) | Position in the alignment | Position in the sequence (without gaps) | Putative parentals (Major x Minor) | R | G | B | M | C | S | 3S | |||||||||||||||
| Homo sapiens | HCoV/NL63 | KF530112 | 2456-4262 | 2225-3997 | MK334047 x KF530110 | 3.350.10 E -3 | - | - | 1.893.10 E -3 | 6.725.10 E -3 | 1.106.10 E -2 | - | |||||||||||||||
| 2488-4144 | 2257-3882 | MK334047 x MK334044 | 2151.10 E -5 | 4.755.10 E-6 | 1.914. 10 E-2 | 1.953.10 E -4 | 1.106.10 E -4 | 4.744.10 E -2 | 3.542.10 E -6 | ||||||||||||||||||
| 3821-4262 | 3560-3997 | MK334047 x Unknown (MK334044) | 3.738.10 E -2 | - | 1.914.10 E -2 | 4.459.10 E -4 | - | 5.568.10 E -3 | 3.542.10 E -6 | ||||||||||||||||||
| 4145-end | 3883-end | JX104161 x Unknown (KF530105) | 1.028.10 E -3 | 4.571.10 E -3 | - | 5.329.10 E -6 | 2.714.10 E -4 | 3.366.10 E -30 | |||||||||||||||||||
| 4262-end | 3997-end | MK334044 x MK334047 | - | - | - | 1.237.10 E -2 | 7.498.10 E -4 | 4.757.10 E -27 | 1.849.10 E -6 | ||||||||||||||||||
| MK334047 | 2456-4262 | 2225-3997 | KF530112 x Unknown (KF530110) | 3.350.10 E -3 | - | - | 4.18010 E -2 | 3.502.10 E -3 | 1.106.10 E -2 | 3.020.10 E -2 | |||||||||||||||||
| 3603-end | 3345-end | JX104161 x Unknown (KF530105) | 1.028.10 E -3 | 4.671.10 E -3 | - | 5.329.10 E -6 | 2.714.10 E -4 | 3.366.10 E -30 | 3.488.10 E -4 | ||||||||||||||||||
| 3911-4206 | 3650-3941 | KF530112 x Unknown (KF530105) | 7.334.10 E -3 | 1.745.10 E -2 | 5.902.10 E -4 | - | - | 1.106.10 E -2 | 1.404.10 E -2 | ||||||||||||||||||
| MK334046 | 2457-end | 2226-end | KF530112 x Unknown (KF530110) | 3.350.10 E -3 | - | - | 4.180.10 E -2 | 3.502.10 E -3 | 1.106.10 E -2 | 3.020. 10 E -4 | |||||||||||||||||
| 4284-end | 4019-end | JX104161 x Unknown (KF530105) | 1.028.10 E -3 | 4.671.10 E -3 | - | 5.329.10 E -6 | 2.714.10 E -4 | 3.366.10 E -30 | 3.488.10 E -4 | ||||||||||||||||||
| MK334044 | 129-1044 | 36-914 | KF530112 x KF530105 | 7.936.10 E -8 | 2.906.10 E- 5 | 4.919.10 E 5 | 4.811.10 E -7 | 1.219.10 E -4 | 5.959.10 E -29 | 1.979.10 E -6 | |||||||||||||||||
| 1044-end | 914-end | KF530105 x KF 530 112 | 4.426.10 E -3 | 1.937.10 E -2 | 2.558.10 E -2 | 2.181.10 E -10 | 6.383.10 E -8 | - | - | ||||||||||||||||||
| 1044-1323 | 914-1192 | KF530105 x MG 772808 | 2.041.10 E -5 | 6.929.10 E -5 | 2.775.10 E -3 | 1.746.10 E -4 | 1.684.10 E -3 | 2.817.10 E -3 | 1.286.10 E -4 | ||||||||||||||||||
| MK334043 | 117-1044 | 24-914 | KF530112 x KF530105 | 7.936.10 E -8 | 2.906.10 E -5 | 2.950.10 E -7 | 4.811.10 E -7 | 1.219.10 E -4 | 5.959.10 E -29 | 1.979.10 E -6 | |||||||||||||||||
| 129-1044 | 36-914 | KF530112 x KF530105 | 7.936.10 E -8 | 2.906.10 E -5 | 4.919.10 E -5 | 3.502.10 E -8 | 1.219.10 E -4 | 5.959.10 E -29 | 1.979.10 E -6 | ||||||||||||||||||
| 144-1044 | 51-914 | KF530112 x KF530105 | 7.936.10 E -8 | 2.906.10 E -5 | 4.919.10 E -5 | 4.811.10 E -7 | 1.219.10 E -4 | 5.959.10 E -29 | 1.979.10 E -6 | ||||||||||||||||||
| 1044-1323 | 914-1192 | KF530105 x MG772808 | 2.041.10 E -5 | 6.929.10 E -5 | 2.775.10E -3 | 1.746.10 E -4 | 1.687.10 E -3 | 2.817.10 E -3 | 1.286.10 E -4 | ||||||||||||||||||
| Recombination pattern | p-value | ||||||||||||||||||||||||||
| Host | Coronavirusspecies | RecombinantIsolate(accession #) | Position in the alignment | Position in the sequence (without gaps) | Putative parentals (Major x Minor) | R | G | B | M | C | S | 3S | |||||||||||||||
| Homo sapiens | HCoV-NL63 | MK334043 | 1044-end | 914-end | KF530105 x KF530112 | 4.426.10 E -3 | 1.937.10 E -2 | 2.558.10 E -2 | 2.181.10 E -10 | 6.383.10 E -8 | 1.758.10 E -8 | - | |||||||||||||||
| MG772808 | 1863-4266 | 1668-3961 | MK334047 x KF530110 | 3.350.10 E -3 | - | - | 1.893.10 E -3 | 6.725.10 E -3 | 1.106.10 E -2 | - | |||||||||||||||||
| 2913-4144 | 2661-3882 | MK334047 x MK334044 | 2.151.10 E -5 | 4.755.10 E -6 | 1.914.10 E -2 | 1.953.10 E -4 | 1.106.10E -4 | 4.744.10 E -2 | 3.542.10 E -6 | ||||||||||||||||||
| 3821-4144 | 3560-3882 | MK334047 x Unknown (MK334044) | 3.738.10 E -2 | - | 1.914.10 E -2 | 4.459.10 E -4 | - | 5.568.10 E -3 | 3.542.10 E -6 | ||||||||||||||||||
| 4288-end | 4023-en d | MK334044 x MK334047 | - | - | - | 1.237.10 E -2 | 7.498.10 E -4 | 4.757.10 E -4 | 1.849.10 E -6 | ||||||||||||||||||
| JX104161 | 59-1044 | 0-917 | KF530112 x KF530105 | 7.936.10 E -8 | 2.906.10 E -5 | 2.950.10 E -7 | 4.811.10 E -7 | 1.219.10 E -4 | 5.959.10 E -29 | 1.979.10 E -6 | |||||||||||||||||
| 129-1044 | 36-917 | KF530112 x KF530105 | 7.938.10 E -6 | 2.906.10 E -5 | 4.919.10 E -5 | 4.811.10 E -7 | 1.219.10 E -4 | 5.959.10 E -29 | 1.979.10 E -6 | ||||||||||||||||||
| 1044-1344 | 917-1216 | KF530105 x MG772808 | 2.041.10 E -5 | 6.929.10 E -5 | 2.775.10 E -3 | 1.746.10 E -4 | 1.684.10 E -3 | 2.817.10 E -3 | 1.286.10 E -4 | ||||||||||||||||||
| 1044-end | 917-end | KF530105 x KF530112 | 4.426.10 E -3 | 1.937.10 E -2 | 2.558.10 E -2 | 2.181.10 E -10 | 6.383.10 E -8 | 1.758.10 E -3 | - | ||||||||||||||||||
| HCoV-HKU1 | MK167038 | 1344-1615 | 1252-1495 | KY674921 x KF686344 | 4.764.10 E -52 | 2.256.10 E -50 | 1.396.10 E -48 | 3.8.10 E -14 | 3.639.10 E -14 | 1.277.10 E -18 | 3.6.10 E -12 | ||||||||||||||||
| 1344-1615 | 1252-1495 | KY674921 x NC_006577 | 8.3.10 E -52 | 4.007.10 E -50 | 2.414.10 E -48 | 4.409. 10 E -14 | 3.603.10 E -14 | 1.967.10 E -19 | 3.6.10 E -12 | ||||||||||||||||||
| Recombination pattern | p-value | ||||||||||||||||||||||||||
| Host | Coronavirus species | RecombinantIsolate(accession #) | Position in the alignment | Position in the sequence (without gaps) | Putative parentals (Major x Minor) | R | G | B | M | C | S | 3S | |||||||||||||||
| Animal(Bat) | SARS-CoV. | MG772934 | 1178-2640 | 967-2172 | MN996532 x DQ022305 | 2.808.10 E -2 | - | 2.590.10 E -7 | 1.403.10 E -6 | 1.899.10 E -7 | 2.760.10 E -5 | 4.353.10 E -9 | |||||||||||||||
| 1202-1494 | 991-1267 | MT499217 x DQ022305 | 2.760.10 E -2 | - | - | - | 3.935.10 E -2 | 2.456.10 E -4 | 3.031.10 E -5 | ||||||||||||||||||
| 1792-2640 | 1438-2172 | MN996532 x DQ022305 | 2.808.10 E -2 | - | 6.570.10 E -4 | 2.010.10 E -4 | 2.283.10 E -5 | 2.760.10 E -5 | 4.353.10 E -9 | ||||||||||||||||||
| 1850-2632 | 1478-2164 | MN996532 x AY686863 | 1.826.10 E -3 | - | - | 2.009.10 E -3 | 2.373.10 E -5 | 2.786.10 E -2 | - | ||||||||||||||||||
| MG772933 | 1149-1494 | 989-1270 | MT499217 x DQ022305 | 2.760.10 E -2 | - | - | - | 3.935.10 E -2 | 2.456.10 E -4 | 3.031.10 E -5 | |||||||||||||||||
| 1163-2640 | 957-2175 | MN996532 x DQ022305 | 2.808.10 E -2 | - | 6.570.10 E -4 | 2.010.10 E -4 | 2.283.10 E -5 | 2.760.10 E -5 | 4.353.10 E -9 | ||||||||||||||||||
| 1866-2623 | 1497-2158 | MN996532 x AY686863 | 1.826.10 E -3 | - | - | 2.009.10 E -3 | 2.373.10 E -5 | 2.786.10 E -2 | - | ||||||||||||||||||
| 2197-2561 | 1782-2096 | MN996532 x DQ022305 | 2.808.10 E -2 | - | 6.570.10 E -4 | 2.010.10 E -4 | 2.283.10 E -5 | 2.760.10 E -5 | 4.353.10 E -9 | ||||||||||||||||||
| DQ022305 | 1178-1661 | 955-1365 | MN996532 x MG772934 | 2.369.10 E -3 | - | 4.270.10 E -3 | 9.977.10 E -3 | 1.038.10 E -3 | 1.560.10 E -2 | 2.687.10 E -4 | |||||||||||||||||
| Cluster | Subgroup | Coronavirus species | AICc | ∆AICc | Breakpoint location | LHS p-value | RHS p-value | Significance |
| Cluster I | Subgroup III | SARS-CoV-1, SARS-CoV-2 (Homo sapiens), and SARS-CoV. (Animals) | 77709.3 | 221.891 | 206 | 0.00120 | 0.00060 | *** |
| 795 | 1.00000 | 0.00060 | N.S. | |||||
| 2043 | 0.99960 | 0.00060 | N.S. | |||||
| Cluster II | None | MERS-CoV/Homo sapiens and Camel/Dromedary | 12135.5 | 12.2531 | 2382 | 0.23880 | 0.00020 | N.S. |
| Cluster III | Subgroup I | HCoV/229E | 32821.7 | 19.5223 | 680 | 1.00000 | 0.00080 | N.S. |
| 1049 | 0.00080 | 0.00080 | *** | |||||
| 1223 | 1.00000 | 0.64400 | N.S. | |||||
| 3332 | 0.27040 | 0.00080 | N.S. | |||||
| Subgroup II | HCoV/NL63 | 24759.4 | 7.68904 | 325 | 0.00100 | 0.98000 | N.S. | |
| 907 | 1.00000 | 1.00000 | N.S. | |||||
| 1533 | 0.74300 | 0.01100 | N.S. | |||||
| 2260 | 0.00100 | 0.00100 | *** | |||||
| 3432 | 0.26100 | 0.01400 | N.S. | |||||
| Cluster IV | Subgroup I | HCoV/OC43 | 50702.4 | 9.07933 | 82 | 1.00000 | 1.00000 | N.S. |
| 448 | 0.00100 | 0.00100 | *** | |||||
| 1510 | 0.01300 | 0.25900 | N.S. | |||||
| 1649 | 1.00000 | 0.00400 | N.S. | |||||
| 3557 | 1.00000 | 0.15200 | N.S. | |||||
| Subgroup II | HCoV/HKU1 | 31777.5 | 175.713 | 1251 | 1.00000 | 0.00120 | N.S. | |
| 1500 | 0.26880 | 1.00000 | N.S. | |||||
| 1677 | 0.00120 | 0.00120 | *** | |||||
| 2136 | 0.00120 | 0.00120 | *** | |||||
| 2254 | 0.07440 | 1.00000 | N.S. | |||||
| 3120 | 0.00120 | 0.96960 | N.S. |
Figure 8.Graphs displaying potential recombination breakpoints illustrated by downward peaks in aligned sequences of spike glycoprotein-coding gene of coronaviruses lineages belonging to a) cluster I (subgroup III) (SARS-CoV/bats and pangolin), b) cluster III (subgroup I) (HCoV/229E), c) cluster III (subgroup II) (HCoV/NL63), d) cluster IV (subgroup I) (HCoV/OC43) and e) cluster IV (subgroup II) (HCoV/HKU1) determined by RECCO algorithm.
Gene Duplication Events
This evolutionary mechanism, defined as the existence of genetic elements that encode for the same function resulting in sequence redundancy, was searched in all sequences of spike glycoprotein-coding gene considering each subdivison separately as was the case for previous analyses. Based on the reconstruction of a newick tree performed by MEGA-X algorithm, search was done in all branching points of the topology. The search for duplication events was accomplished by determining the position of the root on a branch(es) that generated the minimum number of duplication events using an unrooted gene tree (newick) analysis. As a result, although gene duplication events were revealed in all nodes of each tree of seven subdivisions cluster I (subgroups I and II) cluster II cluster III (subgroups I and II) and cluster IV (subgroups I and II), they were located in only two branching points (the rooted node and the branching point of two Tunisian SARS-CoV-2 lineages (MT955170, and MT499217) belonging to subgroup III of cluster I (Figure 9). Thus, from this analysis, it was possible to conclude that the more highly similar the sequences, the greater the possibilities of detecting gene duplication events. In point of fact, the pairwise nucleotide identity comparison produced for subgroup III (cluster I) (a highly heterogenous subgroup), an interval with the greatest difference in percentages i.e., 26.76%-99.92% (Table 1S).
Figure 9.Cladogram depicting gene duplication events in the rooted ancestor as well as in the node of two Tunisian SARS-CoV-2 lineages (shown by two arrows). Identification was done by searching for all branching points in the topology with at least one species that is present in both subtrees of the branching point. An unrooted gene tree was used for the analysis such that the search for duplication events was performed by finding the placement of the root on a branch or branches that produced the minimum number of duplication events. Evolutionary analyses were conducted in MEGA-X.
Selective Pressure Inference
Natural selection, briefly defined as the unequal survival and reproduction of hereditary material due to environmental forces resulting in the preservation of favorable adaptations, was screened in aligned sequences of all eight described subdivisions. To find selection signature over sequences, site-specific models (SLAC, REL, FEL, IFEL, FUBAR, and MEME) and branch-specific models (aBSREL and GA-branch), were used. As indicated in Table 5 for the first category of models (site-specific), whereas purifying selection was constantly detected in the subdivisions : cluster I (subgroup III), cluster II, cluster III (subgroups I and II), and cluster IV (subgroups I and II), adaptive selection was irregularly detected. More specifically, regardless to the subdivision tested, the models IFEL (6/8), FEL (5/8), and MEME (5/8) were more suited to detecting positive selection signatures than SLAC (1/8), FUBAR (1/8), and REL (3/8) models. The highest number of positively and negatively selected sites were revealed in the sequences of HCoV/HKU1 and HCoV/NL63 isolates with 206 and 195 sites, respectively and imparted by REL model. Contrariwise, only a single positively selected site was detected through the sequences of MERS/CoV (IFEL, and FUBAR), HCoV/229E (REL) and the mixed group (cluster I, subgroup III) (REL) isolates. In like manner, only a single negatively selected site was found in the sequences of MERS/CoV isolates (IFEL). Overall, a significant number of sites underwent positive selection as reaveled by MEME model particularly in the sequences of the mixed group (cluster I, subgroup III) (46 sites) and HCoV/229 (43 sites) isolates to a lesser extent in the sequences of HCoV/NL63 (17 sites), HCoV/OC43 (34 sites), and HCoV/HKU1 (34 sites) isolates. At all events, most sites were under purifying selection. Outstandingly, compared to all the other models, the counting method SLAC was a lesser performer in detecting positive as well as negative selection signatures. More importantly, all previously described models failed to detect neither positive nor negative selection in the sequences of SARS-CoV-1 (cluster I, subgroup I) and SARS-CoV-2 (cluster I, subgroup II) isolates (Table 5). Relating to the second category of models (branch-specific), with aBSREL algorithm and after correcting for multiple testing, significance was assessed using the Likelihood Ratio Test (LRT) at a threshold of p ≤ 0.05 resulting in the evidence of episodic diversifying selection on one branch (out of 18), one branch (out of 21), five branches (out of 21), one branch (out of 23), seven branches (out of 23), and five branches (out of 17) of the subdivisions representing the mixed group, MERS-CoV, HCoV/229E, HCoV/NL63, HCoV/OC43, and HCoV/HKU1 species, respectively. On the contrary, no evidence of episodic diversifying selection was found in the sequences of the remaining subdivisions representing SARS-CoV-1, and SARS-CoV-2 species (Table 6). In parallel and in order to shed light onto the lineage-specific nature of the selective constraints exerted on each branch of the reconstructed trees, GA-branch algorithm was employed. On the basis of the use of the statistical approach employing small-sample AIC (c-AIC) best scores, the branches were grouped into two classes for the subdivisions of SARS-CoV-1 and SARS-CoV-2 species and the mixed group, four classes for the subdivisions of MERS-CoV, HCoV/229E, and HCoV/OC43 species, and last, five classes for the subdivisions of HCoV/NL63, and HCoV/HKU1 species with the support of 275, 1876, 7288, 2831, 1526, 1395, 1871, and 2548 tested models at 95% confidence set, respectively (Table 7). Withal, although the lineages of the subdivisions of SARS-CoV-1, and SARS-CoV-2 were not under selection, those of the mixed group, MERS-CoV, and HCoV/229E species experienced predominately purifying selection ; indeed, the total percentages of the branches of the tree where dN/dS <1 were 82%, 53%, and 75%, respectively. In contrast, members of the remaining subdivisions i.e., HCoV/NL63, HCoV/OC43, and HCoV/HKU1 species were predominately under adaptive selection with the following rates : 99%, 58%, and 65%, respectively (Table 7). In other respects, BUSTED with synonymous rate variation found evidence (LRT with p = 0.00 ≤ 0.05) of gene-wide episodic diversifying selection only in the selected branches of the phylogeny of the clade representative of the mixed group (cluster I, subgroup III). As a consequence, there was evidence that at least one site on at least one test branch had experienced diversifying selection. At the end, PARRIS model was able to detect positive selection in only the clades HCoV/NL63 and HCoV/HKU1 species (Table 3S).
Table 5. The number of positively and negatively selected sites in a total of 115 sequences of spike glycoprotein-coding gene of coronavirus species members of clusters I (subgroups I, II, and III), II, III (subgroups I, and II), and IV (subgroups I, and II) estimated by SLAC, IFEL, FEL, MEME, FUBAR, and REL models.| Cluster | Subgroup | Coronavirusspecies | SLAC* | IFEL* | FEL* | MEME* | FUBAR* | REL* | ||||||
| Number of selected sites | Number of selected sites | Number of selected sites | Number of selected sites | Number of selected sites | Number of selected sites | |||||||||
| Positive | Negative | Positive | Negative | Positive | Negative | Positive | Negative | Positive | Negative | Positive | Negative | |||
| Cluster I | Subgroup I | SARS-CoV-1 | 0 | 0 | 0 | 0 | 0 | 0 | 0 | N/A | 0 | 0 | 0 | 0 |
| Subgroup II | SARS-CoV-2(Humans +Tiger) | 0 | 0 | 0 | 0 | 0 | 0 | 0 | N/A | 0 | 0 | 0 | 0 | |
| Subgroup III | SARS-CoV-1,SARS-CoV-2, and SARS-CoV (Animals) | 5 | 16 | 27 | 52 | 27 | 65 | 46 | N/A | 0 | 16 | 1 | 34 | |
| Cluster II | None | MERS-CoV(Humans +Camel) | 0 | 3 | 1 | 1 | 0 | 8 | 0 | N /A | 1 | 24 | 0 | 35 |
| Cluster III | Subgroup I | HCoV/229E | 0 | 6 | 19 | 54 | 7 | 45 | 43 | N/A | 0 | 12 | 1 | 23 |
| Subgroup II | HCoV/NL63 | 0 | 6 | 10 | 99 | 9 | 137 | 17 | N/A | 0 | 54 | 0 | 195 | |
| Cluster IV | Subgroup I | HCoV/OC43 | 0 | 6 | 25 | 50 | 12 | 41 | 34 | N/A | 0 | 14 | 0 | 13 |
| Subgroup II | HCoV/HKU1 | 0 | 4 | 9 | 59 | 2 | 123 | 34 | N/A | 0 | 116 | 206 | 113 | |
| Cluster | Subgroup | Coronavirusspecies | ω rate classes | Number of branches | % of branches | % of tree length | Number of branches under selection |
| Cluster I | Subgroup I | SARS-CoV-1 | 1 | 6 | 100 | 100 | 0 |
| Subgroup II | SARS-CoV-2(humans +Tiger) | 1 | 10 | 100 | 100 | 0 | |
| Subgroup III | SARS-CoV-1+SARS-CoV-2+SARS-CoV (Animals) | 1 | 8 | 44 | 0.020 | 1 | |
| 2 | 10 | 56 | 100 | 0 | |||
| Cluster II | None | MERS-CoV Homo sapiens +Camel/Dromedary | 1 | 20 | 95 | 8.4 | 0 |
| 2 | 1 | 4.8 | 92 | 1 | |||
| Cluster III | Subgroup I | HCoV/229E | 1 | 15 | 71 | 0.00077 | 0 |
| 2 | 6 | 29 | 100 | 5 | |||
| Subgroup II | HCoV/NL63 | 1 | 20 | 87 | 0.66 | 0 | |
| 2 | 3 | 13 | 99 | 1 | |||
| Cluster IV | Subgroup I | HCoV/OC43 | 1 | 15 | 65 | 0.0010 | 0 |
| 2 | 8 | 35 | 100 | 7 | |||
| Subgroup II | HCoV/HKU1 | 1 | 10 | 59 | 0.0019 | 0 | |
| 2 | 7 | 41 | 100 | 5 |
| Cluster | |||||||||
| Cluster I | Cluster II | Cluster III | Cluster IV | ||||||
| Subgroup | Subgroup I | Subgroup II | Subgroup III | N/A | Subgroup I | Subgroup II | Subgroup I | Subgroup II | |
| Coronavirus species | SARS-CoV-1(humans) | SARS-CoV-2(humans + tiger) | SARS-CoV/(animals + humans) | MERS/CoV(humans +camel) | HCoV/229E(humans) | HCoV/NL63(humans) | HCoV/OC43(humans + bovine) | HCoV/HKU1(humans) | |
| # rates | 2 | 2 | 2 | 4 | 4 | 5 | 4 | 5 | |
| c-AIC | 10018.3 | 10161.8 | 77653.7 | 11737 | 36279.4 | 24556.9 | 52150.6 | 35343.6 | |
| ∆c-AIC | 4.66823 | 6.29354 | 3.5932 | 3.26432 | 1.06512 | 5.41797 | 2.85 | 1.44849 | |
| Number of models in 95% confidence set | 275 | 1876 | 7288 | 2831 | 1526 | 1871 | 1395 | 2548 | |
| Class I | dN/dS | 1 | 0 | 1.5271 | 1 | 0.0553 | 1.0716 | 0.8282 | 1.0410 |
| # branches | 4 | 3 | 7 | 5 | 6 | 3 | 6 | 7 | |
| % | 60 | 29 | 18 | 10 | 0 | 0 | 42 | 65 | |
| Class II | dN/dS | 0 | 1 | 0.4878 | 0.6042 | 0.3115 | 0 | 0.1008 | 0.6476 |
| # branches | 3 | 10 | 12 | 6 | 7 | 7 | 5 | 2 | |
| % | 40 | 71 | 82 | 36 | 1 | 0 | 0 | 24 | |
| Class III | dN/dS | - | - | - | 0.000 | 1.3927 | 0.1893 | 1.7708 | 0.0687 |
| # branches | - | - | - | 13 | 5 | 7 | 7 | 3 | |
| % | - | - | - | 37 | 25 | 1 | 58 | 11 | |
| Class IV | dN/dS | - | - | - | 0.1050 | 0.9925 | 0.059 | 0.0127 | 0.1798 |
| # branches | - | - | - | 5 | 5 | 6 | 7 | 3 | |
| % | - | - | - | 17 | 74 | 0 | 0 | 0 | |
| Class V | dN/dS | - | - | - | - | - | 21.9245 | - | 0 |
| # branches | - | - | - | - | - | 4 | - | 4 | |
| % | - | - | - | - | - | 99 | - | 0 | |
Discussion
Severe Acute Respiratory Syndrome Coronavirus 2 (SARS-CoV-2) is widespread over the globe. Many aspects relating to its evolution remain unresolved. Consequently, it is essential to understand if transmissibility, virulence and pathogenicity of SARS-CoV-2 are still in an active phase of adaptation to new individuals and environments. Elucidating molecular evolutionary mechanisms controlling the COVID-19 pandemic and its devastating effect is crucial for forecasting and the choice of the best way for its annihilation. In this study, the author conducted an in-depth analysis to scrutinize under which evolutionary driving force SARS-CoV-2 can evolve in order to get more chance to survive by escaping body’s defenses. Since the crown-shaped spikes enable the binding to and penetrating into the host cells, they are constantly challenged and undergo rapid molecular evolution. For this reason, the choice was made on this glycoprotein and on the gene encoding it. Accordingly, 15 Tunisian accessions of SARS-CoV-2 of Spike glycoprotein-coding gene were part of a set of sequences encompassing at the same time sequences from other coronaviruses infecting humans and animals. Based on networked phylogenetic relationships, eight subdivisions were delineated after a lineage rearragement performed using SplitTree4 algorithm. A panel of analyses involving various methods and algorithms showed that SARS-CoV-2 experienced neither recombination nor selection. These results were consistent with those of Bai et al. 43 who stressed that, currently, SARS-CoV-2 is going through a neutral evolution. In addition, Zhan et al. 44 tested 3,090 isolates of SARS-CoV-2 and didn’t detect any recombination signature. Moreover, both SARS-CoV-1 and SARS-CoV-2- behaved in the same way despite the fact that they were phylogenetically distant as confirmed by Kasibhatla et al. 42. Conversely, this study pointed out that various clades of human and animal SARS-CoVs contained different sequences of spike gene whose evolution were impacted by recombination and selective pressures. These results were in good agreement with those of Forni et al. 1 and Touati et al. 45. The datamonkey and HyPhy team (covid19.datamonkey.org) gave further support regarding recombination events detection. In this context, they analyzed 161,193 whole length sequences sampled between 24 december 2019 and 30 december 2020 collected in entire world and team members came into the conclusion that there was no recombination in the current pandemic virus genomes. Regarding natural selection, by testing 1,273 sites (in 73,597 sequences) in the protein S, they found that 30 were adaptively selected ; whereas, 151 sites were negatively selected. In light of these results, the genetic diversity of SARS-CoV-2 seemed to be in majority shaped by mutation. In point of fact, McCarthy et al. 46 found recurrent deletions in the S protein of SARS-CoV2. These deletions may abolish fixation of a reporter neutralizing antibody and evolved antigenic sites may allow to escape immune system. In addition, by examining the sequence of S protein of the accession NC_045512, Wang et al. 47 found that it contained 1,004 mutations located in the subunit S1 where the amino acids 442-487 could impact viral binding to human ACE2. These mutations may affect the binding affinity and the transmissibility of SARS-CoV-2. Besides, vaccines and diagnostic test development may be altered. Furthermore, Isabel et al. 48 identified the missense mutation D614G in the protein S which found to be implicated in the interaction with human ACE2 receptor. Similarly, Benvenuto et al. 49, noted the presence of two mutations targeting the adjacent regions nsp6 and ORF10. Both mutations could confer scarce stability of the protein structures.
As of March 2020, the Tunisian officials imposed a stringent lockdown in order to curb the number of infected people and reduce the negative impact on the country’s economy. At the end of six weeks, about 50 deaths have been recorded. By the end of September 2020, there was an upsurge of infection by SARS-CoV-2 due to relaxation of part of the population. Unfortunately, many citizens trivialized the disease and its incidence. As a result, as of February 25, 2021, 230,443 confirmed cases of COVID-19 have been reported resulting in 7,869 deaths (worldometers.info/coronavirus/country/tunisia/). To date, there are no specific anti-SARS-CoV-2 drugs ; in contrast, there are vaccines able to offer hope for a path out of pandemic, but not yet available in the country (vaccination should start in March, 2021, according to officials and it is the medical staff that will benefit first). More importantly, today in Tunisia, people are concerned about the recent emergence in the country of the British variant (B 1.1.7) of SARS-CoV-2 (announced on March 2d, 2021 by the Tunisian authorities) which has been estimated to be more contagious than the previously circulating form of the virus. On the other hand, it was reported in other countries the presence of another variant from South Africa as well as the variant (B.1.1.248) detected in Japan in travelers returning from Brazil. The latter possesses both the N501Y mutation, the most infectious, as well as the E484K mutation which is present on the "South African" variant. The combination of the two mutations could impact negatively the effectiveness of the vaccines and, at the same time, it could be very contagious. Similarly, a new variant called B.1.526 was identified in New York. It contains the mutations E484K and S477N that could reduce the effectiveness of vaccines (to be ascertained). Therefore and in order to prevent further possible appearance and spread of these variants in Tunisia, it is compulsory to comply with the health protocol stipulating that social distancing, the wearing of masks and the frequent hand washing must be respected. Further, the ventilation of areas used by occupants is of a considerable importance.
The current pandemic is the sixth to strike humanity since the Spanish flu of 1918. But the frequency and severity of these global epidemics may well accelerate in the years to come, due to our way of life and the incredible adaptive capacities of viruses. Changes in the way we use land, the expansion and intensification of agriculture, as well as unsustainable trade, production and consumption are disrupting nature and increasing contact between wildlife, livestock, pathogens and humans. It's a path that leads straight to pandemics. We are much more threatened by viruses, whose genetic plasticity is decisive for the jump from one species to another. SARS-CoV-2, after having undoubtedly remained dormant for years in an animal reservoir, we now know that the virus most likely originates from the bat in which it would have differentiated from other lineages 40 to 70 years ago. In intensive farming, thousands of animals with great genetic homogeneity, crammed together in one place ; these are the ideal conditions for the virus to develop and make the mutations necessary to adapt to humans. A new threat to humans which boils down to the possible future appearance of SADS-CoV (Swine Acute Diarrhea Syndrome Coronavirus) which has been recorded in pigs and able to infect and replicate in human cells. Similarly, another zoonotic illness caused by Nipah virus may constitute an additional threat to humanity. It can cause severe disease and death in people. The Nipah virus transmission is thought to result from a direct contact with sick pigs as well as through consumption of fruits contaminated by saliva or urine from infected fruit bats. To date, no drug or vaccine targets Nipah virus. In other respects, recently in the United States, researchers have discovered human-to-human transmission of Chapare virus, a rare virus that can cause hemorrhagic fevers. They believe that rats carry this virus and then transmit it to humans. Symptoms of the disease are fever, abdominal pain, vomiting, bleeding gums, rash as well as pain behind the eyes. But it seems that the transmissibility is lower than for respiratory viruses such as influenza or Covid-19. Finally, it is recommended to monitor landscapes dominated by human activities more closely than wild areas. In addition, the protection of natural areas and the restoration of habitats degraded by humans could benefit both the environment and public health. Moreover, it is necessary to think about global biosecurity, evaluate weaknesses and strengthen health systems in developing countries.
Author’s Contribution
The author conceived himself the study, collected data, carried out the analyses, wrote and revised the manuscript.
Funding
No funding was used to conduct this research
Data Availability
The nucleotide sequences used in this study are available from the database GenBank (https://www.ncbi.nlm.nih.gov/).
Compliance with Ethical Standards
Ethics Approval
Not required
References
- 1.Forni D, Cagliani R, Clerici M, Seroni M. (2017) Molecular evolution of coronavirus genome. , Trends Microbiol 25(1), 35-48.
- 2.Morse J S, Lalonde T, Xu S, Liu W R. (2020) Learning from the past: possible urgent prevention and treatment options for severe acute respiratory infections caused by 2019-nCoV. , Chembiochem 21, 730-8.
- 3.Huang Y, Yang C, Xu X F, Xu W, Liu S W. (2020) Structural anf functional properties of SARS-CoV-2 spike protein : potential antivirus drug development for COVID-19. , Acta Pharmacol Sinica 41, 1141-1149.
- 4.Nelson C W, Arden Z, Goldberg T L, Meng C, Kuo C H et al. (2020) Dynamically evolving novel overlapping gene as a factor in the SARS-CoV-2 pandemic. eLife 9:e59633. DOI: https://doi.org/10.7554/eLife.59633
- 5.Boulila M, ElSayed A I, Rafudeen M S, Omar A A. (2020) Investigating molecular evolutionary forces and phylogenetic relationships among melatonin-precursor-encoding genes of different plant species. , Doi :, Mol Biol Rep 47, 1625-1636.
- 6.Crow K D, Wagner G P. (2006) What is the role of genome duplication in the evolution of complexity and diversity. Proceeding of the SMBE tri-national young investigator’s workshop 2005. Mol Biol Evol 23(5) : 887-892.
- 7.Loriere E S, Holmes E C. (2013) Gene duplication is infrequent in the recent evolutionary history of RNA viruses. , Mol Biol Evol 30(6), 1263-1269.
- 8.Willemsen A, Zwart M P, Higueras P, Sardanyés J, Elena S F. (2016) Predicting the stability of homologous gene duplication in a plant RNA virus. bioRxiv. https://doi.org/10.1101/060517
- 10.Nagy P, Simon A E. (1997) New insights into the mechanisms of RNA recombination. , Virology 235(1), 1-9.
- 11.Denison M R, Graham R L, Donaldson E F, Eckerle L D, Baric R S. (2011) . , Coronaviruses. RNA Biology 8(2), 270-279.
- 12.Jeffares D C, Tomiczek B, Sojo V, dos Reis M. (2015) A beginners guide to estimating the non-synonymous to synonymous rate ratio of all protein-coding genes in a genome.Methods Mol Biol. 1201, 65-90.
- 13.Handrick S, Willmann M B, Eckstein S, Walter M C, Antwerpen M H et al. (2020) Whole genome sequencing and phylogenetic classification of Tunisian SARSCoV2 strains from patients of the Military Hospital in Tunis. Virus Genes. 56, 767-771.
- 14.Larkin M A, Blackshileds G, Brown N P, Chenna R, McGettigan P A et al. (2007) Clustal W and Clustal X version 2.0. , Bioinformatics 23, 2947-2948.
- 15.Kumar S, Stecher G, Li M, Knyaz C, Tamura K. (2018) MEGA X: Molecular Evolutionary Genetics Analysis across computing platforms. , Mol Biol Evol 35, 1547-1549.
- 16.Tavaré S. (1986) Some probabilistic and statistical problems in the analysis of DNA sequences. Pages 57–86 in Lectures on Mathe-matics in the Life Sciences (Vol 17) R. M. Miura, ed , Providence, RI .
- 17.Huson D H, Brayant D. (2006) Application of phylogenetic networks in evolutionary studies. , Mol Biol Evol 23, 254-267.
- 18.Martin D P, Murrell B, Golden M, Khoosal A, Muhire B. (2015) RDP4: Detection and analysis of recombination patterns in virus genomes. , Virus Evolution 1(1), 003-10.
- 19.E Martin D Rybicki. (2000) RDP: detection of recombination amongst aligned sequences. , Bioinformatics 16, 562-563.
- 20.Padidam M, Sawyer S, Fauquet C M. (1999) Possible emergence of new geminiviruses by frequent recombination. Virology265: 218-225.
- 21.Martin D P, Posada D, Crandall K A, Williamson C. (2005) A modified bootscan algorithm for automated identification of recombination sequences and recombination breakpoints. AIDS Res Hum Retroviruses21: 98-102.
- 22.Smith J M. (1992) Analyzing the mosaic structure of genes. Doi : 10.1007/BF00182389 , J Mol Evol34: 126-129.
- 23.Posada D, Crandall K. (2001) Evaluation of methods for detecting recombination from DNA sequences: Computer simulation. Proc Nat Acad Sc98,13757-13762. https://doi.org/10.1073/pnas.241370698 .
- 24.Gibbs M J, Armstrong J S, Gibbs A J. (2000) Sister-scanning: a Monte Carlo procedure for assessing signals in recombinant sequences. , Bioinformatics 16, 573-582.
- 25.Boni M F, Posada D, Feldman M W. (2007) An exact nonparametric method for inferring mosaic structure in sequence triplets. Genetics176: 1035-1047.
- 26.Maydt J, Lengauer T. (2006) RECCO: recombination analysis using cost optimization. , Bioinformatics 22, 1064-71.
- 27.Kosakovsky Pond SL, Posada D, Gravenor M B, Woelk C H.Frost SD (2006a) GARD: a genetic algorithm for recombination detection. , Bioinformatics 22(24), 3096-3098.
- 28.Kosakovsky Pond SL, Posada D, Gravenor M B, Woelk C H.Frost SD (2006b) Automated phylogenetic detection of recombination using a genetic algorithm. , Mol Biol Evol 23(10), 1891-1901.
- 29.Akaike H. (1974) A new look at the statistical model identification. In: Selected Papers of Hirotugu Akaike. 215-222.
- 30.Khishino H, Hasegawa M. (1989) Evaluation of the maximum likelihood estimate of the evolutionary tree topologies from DNA sequence data, and the branching order inHominoidea.J. , Mol Evol 29, 170-179.
- 31.Kosakovsky Pond SL, SDW Frost, Muse S V. (2005) HyPhy: hypothesis testing using phylogenies. , Bioinformatics 21(5), 676-679.
- 32.Kosakovsky Pond SL.Frost SDW (2005a) Datamonkey: rapid detection of selective pressure on individual sites of codon alignments. , Bioinformatics 21(10), 2531-2533.
- 33.Murrell B, Moola S, Mabona A, Weighill T, Sheward D et al. (2013) FUBAR: A Fast, Unconstrained Bayesian AppRoximation for inferring selection. , MolBiol Evol 30, 1196-1205.
- 34.Murrell B, Wertheim J O, Moola S, Weighill T, Scheffler K.Kosakovsky Pond SL (2012) Detecting individual sites subject to episodic diversifying selection. , PLOS Genetics 8, 1002764-10.
- 35.Smith M D, Wertheim J O, Weaver S, Murrell B, Scheffler K et al. (2015) Less Is More: An Adaptive Branch-Site Random Effects Model for Efficient Detection of Episodic Diversifying Selection. , Mol Biol Evol 32(5), 1342-1353.
- 36.Kosakovsky Pond SL.Frost SDW (2005b) A genetic algorithm approach to detecting lineage-specific variation in selection pressure. , Mol Biol Evol22 3, 478-485.
- 37.Murrell B, Weaver S, M D Smith, Wertheim J O, Murrell S et al.Kosakovsky Pond SL (2015). Gene-Wide Identification of Episodic Selection. , Mol Biol Evol 32(5), 1365-1371.
- 38.Scheffler K, Martin D P, Seoighe C. (2006) Robust inference of positive selection from recombining coding sequences. , Bioinformatics 22, 2493-2499.
- 39.Delport W, AFY Poon, SDW Frost, Kosakovsky Pond SL. (2010) Datamonkey 2010: a suite of phylogenetic analysis tools for evolutionary biology. , Bioinformatics 29, 2455-2457.
- 40.Weaver S, Shank S D, Spielman S J, Li M, Muse S V et al. (2018) Datamonkey 2.0: A Modern Web Application for Characterizing Selective and Other Evolutionary Processes. , Mol Biol Evol 35(3), 773-777.
- 41.Kosakovsky Pond SL, AFY Poon. (2020) HyPhy 2.5—A Customizable Platform for Evolutionary Hypothesis Testing Using Phylogenies. , Mol Biol Evol 37(1), 295-299.
- 42.Kasibhatla S M, Kinihar M, Limaye S, Kale M M, Kulkarni-Kale U. (2020) Understanding evolution of SARS‐CoV‐2: A perspective from analysis of genetic diversity of RdRp gene. , J Med Virol 92, 1932-1937.
- 43.Bai Y, Jianga D, Lona JR Jerome, Chena X, Hua M et al. (2020) Comprehensive evolution and molecular characteristics of a large number of SARS-CoV-2 genomes reveal its epidemic trends. , Inter J Infect Dis 100, 164-173.
- 44.Zhan X Y, Zhang Y, Zhou X. (2020) Molecular evolution of SARS-CoV-2 structural genes: evidence of positive selection in spike glycoprotein. bioRxiv preprint doi: https://doi.org/10.1101/2020.06.25.170688.
- 45.Touati R, Haddad-Boubaker S, Ferchichi I. (2020) Comparative genomic signature representations of the emerging COVID-19 coronavirus and other coronaviruses: High identity and possible recombination between Bat and Pangolin coronaviruses. , Genomics 112, 4189-4202.
- 46.McCarthy K R, Rennick L J, Nambulli S. (2020) Natural deletions in the SARS-CoV-2 spike glycoprotein drive antibody escape. bioRxiv preprint https://doi.org/10.1101/2020.11.19.389916.
- 47.Wang R, Hozumi Y, Yin C, Wei G W. (2020) . Decoding SARS-CoV2 Transmission and Evolution and Ramifications for COVID-19 Diagnosis, Vaccine, and Medicine. J Chem Inf Model. 60 : 5853-5865.