
Arm Span is an Alternative to Standing Height for Calculation of Body Mass Index (BMI) amongst Older Adults
Abstract
Objectives:
Accurate measurement of height is difficult in older adults because of the reduction in height that occurs during the ageing process. Therefore, several western studies have demonstrated the arm span as an alternative anthropometric measurement to height among older adults, as the length of arm span is less affected by aging. The aim of the study was to use arm span as an alternative to standing height for calculation of body mass index (BMI) amongst older adults.
Methodology:
A community-based cross sectional study was carried out during 2011-12 among 400 (Men: 180; Women: 220) urban geriatric population (age 60-years and over)of the town of Khammam. Weight, height and arm span were measured with standard procedures. Nutritional status of older adults was calculated by body mass index (BMI) classification using both height and arm span.
Key Results:
The mean (SD) height and arm span among men were 164.5 cm (6.6) and 175.3cm (7.9), respectively, while among women were 149.5cm (5.8) and 158.7cm (8.6). The mean difference between arm span and height was 10.8cm (10.1,11.4)in men and 9.2cm (8.3,10.0) in women (p<0.001). Similarly, significant (p<0.001) differences were observed between the BMIs derived using both height and arm span among both the genders.
Conclusion:
The conventional height is not a reliable anthropometric measurement for the assessment of nutritional status of older adults, where the BMI-height model over estimated the nutritional status of older adults compared to the BMI- arm span model. Therefore, arm span is the best alternative to height for calculation of body mass index (BMI) in older adults.
Article Information
- Received
- Accepted
- Published
Academic Editor: Alireza Jahan-mihan, University of North Florida
Checked for plagiarism: Yes
Review by: Single-blind
Copyright © 2016 Nimmathota Arlappa, et al.
 This is an open-access article distributed under the terms of the Creative Commons Attribution License, which permits unrestricted use, distribution, and reproduction in any medium, provided the original author and source are credited.
Corresponding author: Dr N. Arlappa, MD, Scientist ‘E’, Division of Community Studies, National Institute of Nutrition, ICMR, Jamai, -Osmania (P.O), Hyderabad – 500 007, India —
Competing Interests
The authors have declared that no competing interests exist.
Funding
No specific funding statement was provided by the authors.
Data Availability
No data-availability statement was provided by the authors.
Acknowledgements
We are thankful to V.George, Sociologist, Ms D.Sarala and Ms D. Balamani for their co-operation in data collection and data entry. We are also thankful to Dean & Principal, Mamata Medical College, Khammam, Telangana, India for approving the study and rendering co-operation for the successful completion of the study.
Citation:
Introduction
Anthropometric measurements such as weight and height provide simple, non-invasive methods for assessing the nutritional status of populations1 and height is an important measure of body size and for the assessment of nutritional status in children and adults2. Height is also an important parameter used to calculate creatinine height index, basal energy expenditure, basal metabolic rate, vital capacity3, nutrient requirements4 as well as for the calculation of body composition5. Therefore, accurate measurement of height is essential for the assessment of nutritional status of individuals6, 7 as they are at risk of malnutrition8, 9. Height is measured with the subject standing erect on a plain surface without shoes and the head positioned in Frankfurt horizontal plane. The Frankfurt plane is defined as the line joining the inferior margin of the orbit (orbitale) and the tragus of the ear lies in the horizontal plane10, 11. Aging is associated with physiological, psychological and biological changes12. Similarly, as the physical activity levels declines with aging, there will be a change in body composition such as an increase in fat mass and a decrease in lean muscle and bone masses12. Accurate anthropometric measurements in older adults might be difficult to obtain because of changes in body composition, posture, mobility, thinning of intervertebral discs leading to a reduction in height during the aging process13, 14. Similarly, as the measurement of height amongst some patients of an aging population is difficult and unrealistic because of their physical handicap, inability to ambulate, kyphoscoliosis, lower limb contracture and osteoarthritis of hips and knees15, 16. Standing height is also difficult to measure in older adults with paralysis and amputated lower limbs17. In many older persons, the use of body mass index (BMI; weight (kg)/ height (m2)), the conventional index that is used to determine adult nutritional status, is limited by the measurement of height, which is often unreliable18, 19. This unreliable BMI in older age group is because of thinning of the inter-vertebral discs leading to spinal curvature like kyphosis and scoliosis20, 21, and postural changes such as genu valgum and genu varus deformities due to decreased muscle strength22.
Under these changing circumstances in the stature of the older people, the measurement of accurate standing height for the assessment of nutritional status is difficult. Therefore, there is a need for an appropriate and alternative body part to estimate the actual height attained during adulthood amongst older people. Several studies demonstrated other skeletal measurements as an alternative to height for assessing the nutritional status in older adults19, 23, 24. Several authors from different countries have estimated stature from different long bones and other body parts. They include upper25 and lower extremities like the knee height26, 27, 28, 29, foot length30, 31, 32, 33, cephalo-facial measurements20, 30, 34, 35, sternum36, iliac spine37, vertebral length38 and arm span7, 39, 40, 41. However, the alternative measurements for height such as arm-span, knee height and demi-span have been shown to be useful surrogate measures of stature in older people and may be more accurate42, 43 because, the length of long bones in arms and legs do not change with age, unlike vertebral height44.
Arm span is the horizontal distance between the finger tip of the longest digit on one hand to the corresponding point on the other hand, with the subject assuming a "crucifix" position with the arms extended laterally45. The long bone measurement, arm span, corresponds to the maximum height achieved in early adulthood and is relatively less affected by aging and does not shrink with ageing24, 45, 46, suggesting that it may offer an alternative to height in calculating BMI in older populations12, 19. However, most of the studies that looked at the association between arm span and height have focused on Caucasian subjects, and they found that the association between arm span and height differed from race to race46, 47.
Several western studies reported the relationship between arm span and height amongst different age groups and gender39, 40, 41, 42, 43 and few studies in India reported this relationship amongst children and adults. However, such data is not readily available for older adults (age 60 years and over) in India. Hence, keeping in view this objective in mind, a community-based cross-sectional study was carried out amongst older adults with the objective to study the arm span as an alternative to height for calculation of body mass index (BMI).
Materials and Methods
Study Design and Participants
A community based cross-sectional study was carried out adopting a stratified random sampling procedure amongst 400 (Men: 180; Women: 220) urban geriatric members of the population (age 60 years and over) of town of Khammam in India, during July 2011to March 2012.A total of 400 older adults were recruited from 12 out of 36 randomly selected municipal wards of Khammam town. The number of subjects to be covered from each selected municipal ward was derived based on the probability proportional to size (PPS) of population of municipal wards.
Anthropometric Measurements
Anthropometric measurements such as weight, height and arm span were measured using standard equipment and adopting standards procedures. Weight of the subjects was measured to the nearest 100 gm with digital weighing scale (SECA) after asking them to remove their footwear. The height was measured to the nearest 0.1cm using an anthropometric rod, once the subject to stand erect on a flat solid surface (without footwear) with feet together. The length of the arm span was measured using SECA non-elastic measuring tape (Seca 201) to the nearest 0.1cm. The arm span was measured after asking older adult individuals to stand erect with their back to the wall to provide support with both arms extended (with the elbows and wrists extended) at right angles and the palms facing directly forward19. The measurement was taken from the tip of the middle finger on one hand to the tip of the middle finger on the other hand. The BMI was calculated using the formula of weight (kg) / height (m)248. The BMI of less than 18.5 kg/m2 was considered as chronic energy deficiency (CED).
Ethical Clearance and Consent
The study was approved by the Principal & Dean, Mamata Medical College, while ethical clearance was obtained from Chairman, Human Ethics Committee, Mamata Medical College, Khammam. Written informed consent was obtained from the participants after explaining the purpose of the study and assuring them confidentiality of the data. Older adults with kyphosis, scoliosis, lower limb contracture, osteoarthritis of both hip and knee joints, paralysis and amputation were excluded from the study. Older adults who were non-ambulatory and unwilling to participate were also excluded from the study.
Statistical Analysis
Descriptive statistics like mean (SD) height, weight, arm span and BMI were calculated using Statistical Package for Social Science (SPSS) version: 19.049. Pearson's correlation coefficients were used to assess the relationship between height and arm span and represented with scattered plots. Paired t-test was performed to study the mean difference between arm span and height. Bland- Altman plot was done to study the agreement between arm span and standing height. Mantel-Haenszel test was used to study the agreement between BMIs calculated using height and arm span. BMI-arm span cut-off values equivalent to BMI-height were derived using linear regression analysis and area under the curve was estimated by receiver operating characteristic (ROC) curve for the same. Sensitivity, specificity, positive predictive value (PPV) and negative predictive value (NPV) were also calculated for both BMIs. Level of significance was considered when p<0.05.
Results
The mean (SD) age and anthropometric variables of older adults by gender are presented in Table 1.The mean age of men and women was 68.0(6.0) and 67.3 (7.2) years, respectively, While the mean height and arm span amongst men was 164.5 (6.6) cm and 175.3 (7.9) cm, respectively, and the corresponding figures for the women were 149.5 (5.8) cm and 158.7(8.6) cm. Similarly, statistically significant (p<0.001) differences were observed between the body mass index (BMI) derived using both height and arm span amongst both genders. The relationship and correlation coefficients between arm span and height by gender are presented in Table 2. A statistically significant (p<0.001) difference between arm span and height was observed amongst older adults of both genders. The length of the arm span in both genders was significantly (p<0.001) higher than their corresponding standing height and the difference was relatively higher amongst men (10.8 cm) as compared to women (9.2 cm) Figure 1. The correlation between arm span and height was higher amongst men (r = 0.82) as compared to women (r=0.68) (Figure 2 & Figure 4). However, the standing height explaining the percent of variation for the length of arm span was only 67% for men and 47% for women. Similarly, the BMI derived using length of arm span was significantly (p<0.001) lower as compared to the BMI derived using standing height in both genders. While the correlation between BMI-height and BMI-arm span was 0.95 and 0.91 amongst men and women, respectively (Figure 3 & Figure 5). Nutritional status of older adults as per the BMI calculated using both arm span and height is presented in Table 3. The overall prevalence of overweight/obesity (BMI ≥ 25.0) using standing height was 52.1%, while it was only 27.6%, when BMI was calculated using arm span (p<0.001). As per BMI-arm span, the proportion of chronic energy deficiency (CED) and normal weight was significantly (p<0.001) higher amongst both genders as compared to the BMI-height. While, the proportion of overweight and obesity was significantly (p<0.001) higher as per the BMI-height compared to the BMI-arm span amongst both the genders.
Table 1. Mean (SD†) age and anthropometric values of older adults by gender| Men (n=180) | Women (n=220) | |||
| Particulars | Mean(SD) | Range | Mean(SD) | Range |
| Age (yrs) | 68.0(6.0) | 60-93 | 67.3(7.2) | 60-90 |
| Weight (kg) | 68.1(13.6) | 29.9-114.4 | 58.4(12.6) | 27.6-95.2 |
| Height (cm) | 164.5(6.6) | 144.6-181.8 | 149.5(5.8) | 132.5-168.2 |
| Arm span (cm) | 175.3(7.9) | 154.4-194.2 | 158.7(8.6) | 116.1-196.8 |
| BMI*-Height (kg/m2) | 25.1(4.4) | 11.8-40.2 | 26.1(5.1) | 14.9-44.5 |
| BMI*-Arm span (kg/m2) | 22.1(4.0) | 11.1-36.4 | 23.2(4.7) | 13.5-43.3 |
| Particulars | Arm span | Height | Difference (95% CI) | Pearson Correlation | t-Value | |
| r | r 2 | |||||
| Men | ||||||
| Length(cm) | 175.3 | 164.5 | 10.8(10.1,11.4) | 0.82 | 0.67 | 19.03 |
| BMI*(kg/m2) | 22.1 | 25.1 | -3.0(2.8,3.2) | 0.95 | 0.91 | 42 |
| Women | ||||||
| Length(cm) | 158.7 | 149.5 | 9.2(8.3,10.0) | 0.68 | 0.47 | 13.52 |
| BMI(kg/m2) | 23.2 | 26.1 | -2.9(2.6,3.1) | 0.91 | 0.83 | 33.22 |
Figure 1. Bland Altman Plot
Download figure
Figure 2. Scattered diagrams showing correlation between arm span and height & BMI-arm span and BMI-height by gender. The correlation between arm span and height was among men was 0.82.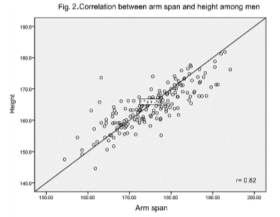
Download figure
Figure 3. Scattered diagrams showing correlation between arm span and height & BMI-arm span and BMI-height by gender. The correlation between BMI-arm span and BMI-height among men was 0.95.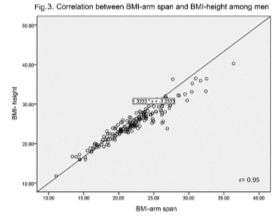
Download figure
Figure 4. Scattered diagrams showing correlation between arm span and height & BMI-arm span and BMI-height by gender. The correlation between arm span and height was among women was 0.68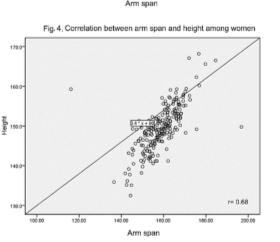
Download figure
Figure 5. Scattered diagrams showing correlation between arm span and height & BMI-arm span and BMI-height by gender. The correlation between BMI-arm span and BMI-height among women was 0.91.
Download figure
In general, according to the BMI calculated using arm span, 57 subjects had CED. Of them, only 24 (42.1%) subjects were correctly classified as having CED when the BMI was calculated using standing height, while 56.1% and 1.8% of those CED subjects were misclassified as normal weight and overweight, respectively. Similarly, amongst those subjects with normal weight, only 57.3% subjects were correctly classified as normal weight and rest of the subjects (42.7%) were misclassified as overweight according to BMI-height. The agreement between BMI-arm span and BMI-height was high only amongst the obese subjects and low amongst the subjects with other categories of nutritional status in both the genders (Table 4).
Table 4. Agreement between BMI*- arm span and BMI-height by gender| BMI-Height | ||||
| N | CED† | Normal | Overweight | Obese |
| 32 | 34.4 (11) | 65.6 (21) | 0 | 0 |
| 110 | 0 | 51.8 (57) | 48.2 (53) | 0 |
| 30 | 0 | 3.3 (1) | 53.3 (16) | 43.3 (13) |
| 7 | 0 | 0 | 0 | 100.0(7) |
| 179 | 6.1 (11) | 44.1 (79) | 38.5 (69) | 11.2 (20) |
| 25 | 52.0 (13) | 44.0 (11) | 4.0 (1) | 0 |
| 122 | 0 | 62.3 (76) | 37.7 (46) | 0 |
| 55 | 0 | 0 | 49.1 (27) | 50.9 (28) |
| 18 | 5.6 (1) | 0 | 0 | 94.4 (17) |
| 220 | 6.4 (14) | 39.5 (87) | 33.6 (74) | 20.5 (45) |
| 57 | 42.1(24) | 56.1(32) | 1.8(1) | 0 |
| 232 | 0 | 57.3(133) | 42.7(99) | 0 |
| 85 | 0 | 1.2(1) | 50.6(43) | 48.2(41) |
| 25 | 4.0 (1) | 0 | 0 | 96.0(24) |
| 399 | 6.3 (25) | 41.6 (166) | 35.8 (143) | 16.3 (65) |
BMI-arm span cut-off values equivalent to known BMI-height cut-off values were derived using linear regression analysis are presented in Table 5. The corresponding BMI-arm span cut-off values equivalent to known BMI-height cut-off values such as BMI <18.5, 25.0 and 30.0 were 16.4, 22.0 and 26.4 respectively.
Table 5. Derivation of BMI-Arm span cut-off values equivalent to BMI-Height cut-off values| BMI-Height | BMI-Arm span |
| 18.5 | BMI-AS=f* (BMI-Height) =0.355+0.868 x BMI =0.355+0.868x18.5 =16.4 |
| 25 | BMI-AS=f (BMI-Height) =0.355+0.868xBMI =0.355+0.868x 25. =0 22 |
| 30 | BMI-AS=f (BMI-Height) =0.355+0.868xBMI =0.355+0.868x 30.0 =26.4 |
| Nutritional Status | Sensitivity | Specificity | PPV | NPV |
| CED† | 0.88 | 0.99 | 0.82 | 0.99 |
| Normal | 0.86 | 0.9 | 0.86 | 0.9 |
| Overweight | 0.76 | 0.9 | 0.8 | 0.9 |
| Obese | 0.86 | 0.95 | 0.78 | 0.97 |
The mean values of arm span and height of older adults in this study are higher as compared to their Chinese, Malaysian and Indonesian counterparts28, 50, 51. The correlation coefficients between arm span and height were higher amongst men (r = 0.82) compared to women (r=0.68) and the corresponding figures reported by Fatmah (2010) for the elderly in Indonesia were 0.79 for men and 0.84 for women28. The corresponding figures for Bosnia and Herzegovinian adults were 0.876 and 0.887, respectively52. Similarly, Kwok and Whitelaw also reported higher correlation (0.93) between height and arm span amongst older people19.
Over estimation of nutritional status is being observed amongst the older adults when BMI was calculated using height, where the prevalence of overweight/obesity (BMI ≥ 25.0) using standing height was 52.1% as against the only 27.6%, using arm span (p<0.001). Similarly, a higher proportion of older adults with CED were misclassified as normal weight and normal weight subjects as overweight using height to calculate BMI. This could be attributed to substantial reduction in the standing height amongst the older adults.
Several studies have shown that height reduces with advancing age53, 54 and that height loss is even greater after 80 years55. Therefore, calculation of nutritional status of aged people using standing height is a not reliable anthropometric measurement. Nishiwaki et al56 also opined that inaccurate BMIs lead to substantial numbers of older adults being misclassified as normal weight or overweight, which can cause significant distortions in data on the impact of underweight and overweight on health outcomes. Siqueira Vde57 also reported that use of the WHO equation (using height) significantly increases the prevalence of overweight, thereby masking the diagnoses of underweight.
Figure 6-8. Estimation of area under curve (AUC) through ROC curve for new BMI-arm span cut-off values (16.4, 22.0 and 26.4) equivalent to known BMI-height (18.5, 25.0 and 30.0). The accuracy of the AUC (95% CI) values of BMI-arm span cut-off values for BMI-height cut-off values were excellent.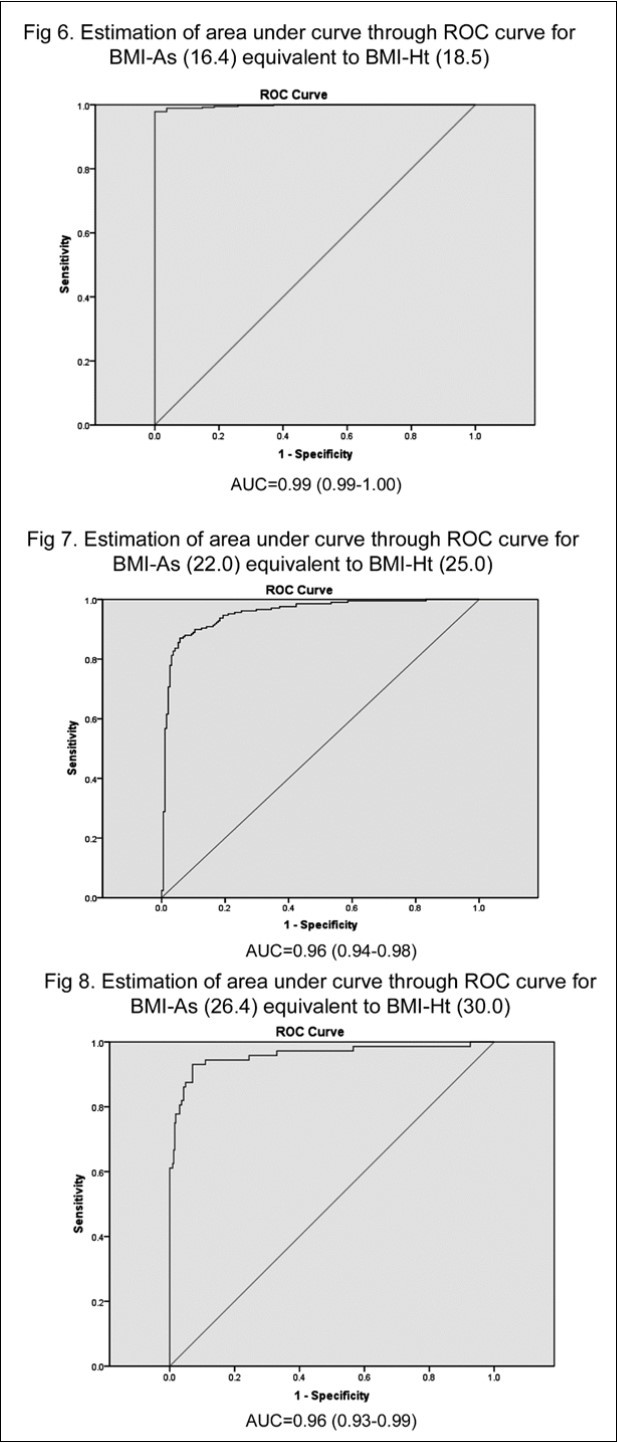
Download figure
Since there was a significant difference in agreement between the different categories of nutritional status assessed using both height and arm span amongst older adults, we derived the BMI-Arm span cut-off values equivalent to known BMI-height cut-off values using regression analysis. The sensitivity between BMI-arm span cut-off values and BMI-height cut-off values ranged from 0.76 to 0.88 for any BMI category, while the specificity ranged from 0.90 to 0.99.
Discussion
The relationship between arm span and height as well as estimation of height from long skeletal bones amongst different age groups and gender was studied by different authors in India. However, such studies and the difference was relatively higher amongst men (10.8cm) as compared towere not readily available amongst the geriatric population in India. Our study, is the first of its kind to study the relationship between length of the arm span and standing height amongst the older adults in India.
In general, significant (p<0.001) differences were observed between the mean arm span and height as well as in BMIs calculated using both arm span and height amongst older adults of both genders.
The length of the arm span in both genders was significantly (p<0.001) higher than their standing height and the difference was relatively higher amongst men (10.8cm) as compared to women (9.2 cm). The difference between arm span and height amongst Malaysian elderly men (7.7 cm) and women (6.1cm) was comparable to the present study50.
However, Kwok et al (2001)reported no difference between the length of the arm span and height amongst Chinese elderly men (6.4cm) and women (6.3cm)51. While, in general, Allen (1989) reported the mean difference between arm span and height as 4.7 cm (range -5 to + 17) amongst the elderly24.
As reported by Fatmah, the sensitivity of predicted body height from arm span to assess the nutrition status compared to the normal nutrition in elderly male and female is high28.
Assessment of nutritional status of the status of the aging population older people is very essential. However, the assessment of their nutritional status using standing height will lead to misclassification of their nutritional status, because of reduction of height associated with ageing. This would adversely impact on the health and nutritional interventions amongst the aged. Therefore, there is a need of alternative anthropometric measurement to height for the accurate assessment of nutritional status amongst older adults. Since arm length is less affected than the height by the aging process, it should be considered as an alternative to stature when assessing the nutritional assessments of the elderly 6, 58. Kwok and Whitelaw19 also reported that arm span as a good alternative measurement for height in older people. Similarly, other studies also reported that the arm span is the most reliable anthropometric measurement for predicting the standing height of an individual and it is a reliable and practical estimate of height in the non-ambulant elderly40, 47, 59.
Therefore, the conventional height is not reliable anthropometric measurement for the assessment of nutritional status of the older adults because of age- related changes in vertebral bones, posture and loss of muscle tone. Therefore, arm span is the best alternative for calculation of body mass index (BMI) and thereby accurate assessment of nutritional status of the aging population.
References
- 2.WHO. Geneva: World Health Organization (1995) Physical status: the use and interpretation of anthropometry. Report of a WHO Expert Committee. WHO Technical Report Series 854
- 3.McPherson J R, Lancaster D R, Carroll J C. (1978) . Stature change with aging in Black Americans.JGerontol.33 .
- 4.Chumlea W C, Guo S, Wholihan K, Cockram D.Kuczmarski R.J,Jhonson CL.(1998) Stature prediction equations for elderly non- Hispanic white, non-Hispanic black and Mexican-American persons developed from. NHANES III data.J Am Diet Assoc.98 137-142.
- 5.Hurley R S, Bartlett B J, Witt D D, Thomas A.Taylor EZ.(1997) Comparative evaluation of body composition in medically stable elderly.J Am Diet Assoc.97. 1105-1109.
- 6.Mitchell C O, Lipchitz.DA .(1982) Arm length measurement as an alternative to height in nutritional assessment of the elderly.JParenterEnteralNutr.6. 226-9.
- 7.Datta Banik S. (2011) Arm span as a proxy measure for height and estimation of nutritional status: A study among Dhimals of Darjeeling in. , West Bengal India.Ann Hum 38(6), 728-35.
- 8.Amarya S, Singh K, Sabharwal M. (2015) Changes during aging and their association with malnutrition.JClinGerentolGeriatr. 6(3), 78-84.
- 9.Ahmed T, HaboubiN. (2010) Assessment and management of nutrition in older people and its importance to health.JClinIntervin Aging. 5, 207-16.
- 11.Lohman T G, Roche A F, Martorell R. (1988) Anthropometric standardization Reference Mannual. , Champaign, Ilinoise:Human KineticsBooks;P3
- 12.Kuchmarski R J. (1989) Need for body composition information in elderly subjects.Am. JClinNutr.50 1150-1157.
- 13.E de Lucia, Lemma F, Tesfaye F, Demisse T, Ismail S. (2002) use of arm span measurement to assess thenutritional status of adults in four Ethiopian ethnic groups.Eur. , J Clin Nutr 56(2), 91-5.
- 14.Prothro J W, Rosenbloom C A. (1993) Physical measurements in an elderly black population: knee height as the dominant indicator of. 48(1), 15-18.
- 15.WDF Smith, Cunningham D A, Paterson D H, Rechnitzer P A, Porter M M et al. (1992) Demispan to predict height and body mass index.Age. Ageing.21(Suppl.1) 11-12.
- 16.Muncie H L, Sobal J, Hoopes J M, Tenney J H, Warren J W. (1987) A practical method of estimating stature of bedridden female nursing home patients.JAmGeriatrSoc.35. 285-289.
- 17.Bermúdez O I, Becker E K, Tucker K L. (1999) Development of sex-specific equations for estimating stature of frail elderly Hispanics living in the northeastern United States.Am. 69(5), 992-998.
- 18.Rabe B.Thamrin MH,Gross R.,Solomons NW. Schultink W .(1996) Body Mass Index of the Elderly Derived from Height and from Arm span. Asia Pac JClinNutr.5 79-83.
- 19.Kwok T.Whitelaw MN.(1991) The use of armspan. in nutritional assessment of the elderly.J AmGeriatrSoc.39, 492 – 496.
- 20.Wankhede K P, Kamdi N Y, Parchand M P, Anjankar V P.Bardale RV.(2012) Estimation of stature from maxillo-facial anthropometry in a central Indian population.J Forensic Dent Sci.4(1),34-37.
- 21.Manandhar M, Ismail I. (1999) Better Nutrition for Older People. Assessment and Action.Help Age International. , London 12-25.
- 22.SGEM Pieterse. London School of Hygiene and Tropical Medicine, University of London (1999) Nutritional vulnerability of older refugees. PhD Thesis
- 24.Allen S C. (1989) The relation between height, armspan and forced expiratory volume in elderly women.Age. , Ageing.18 2, 113-116.
- 25.Ozaslan A, Koc S.Ozaslam I,Tugcu H .(2006) Estimation of stature from upper extremity. MilataryMedicine.171,288–91
- 26.Chumlea W C, Roche A F, SteinbaughML. (1985) Estimating stature from knee height for persons 60 to 90 years of age.J. , AmGeriatrSoc.33 2, 116-120.
- 27.Cockram D B.Baumgartner RN.(1990) Evaluation of the accuracy and reliability of callipers for measuring recumbent knee-height in elderly. 52-397.
- 28.Fatmah. (2010) Validation of predicted height model based on arm span, knee height and sitting height in Indonesian elderly people.JClinMed Res.2. 5, 67-73.
- 29.Ozaslan A, Iscan M Y, Ozaslan I, Tugcu H, Koc S. (2003) . Estimation of stature from body parts.Forensic Sci Int.132(1) 40-5.
- 30.Kishan K.(2008).Estimation of stature from foot print and foot outline dimensions. in Gujjars of North India. Forensic Sci Int.175 93-101.
- 31.Kanchan T, Menezes R G, Moudgil R, Kaur R, Garg RK KotianMS. (2008) Stature estimation from foot dimensions.Forensic Sci Int.179(2-3). 1-5.
- 32.Giles E,Vallandigm PH .(1991) Height estimation from foot and shoe print length. , J Forensic Sci 36, 1143-51.
- 34.Jadhav H R, Shah G V. (2004) Determination of personal height from the length of head in Gujarat region. JAnatSocIndia.53
- 35.Sahni D, Sharma P Sanjeev, Kaur G Harjeet, Aggarwal A. (2010) Estimation of stature from facial measurements in northwest Indians.Leg Med. 12, 23-27.
- 36.Menezes R G, Kumar GP KanchanT, PPJ Rao, Lobi S W, Krishnan K. (2009) Stature estimation from the length of the sternum in South Indian males: a preliminary study.J Forensic Leg Med.16,441–443.
- 37.Nachiket S, Sujatha N, Priya R, Raveendranath V, Rema D et al. (2010) Reliability of inter-anterior superior iliac spinous distance as compared to foot length for stature estimation in South Indians.J Forensic Leg Med.17. 352-354.
- 38.Nagesh K R, Pradeep K G. (2006) Estimation of stature from vertebral column length in south Indians. Leg Med (Tokyo). 8, 279-83.
- 39.Aggarwal A N, Gupta D, Ezekiel L M, Jindal S K. (2000) Statistical estimation of height from arm span in north Indian subjects.Indian JPhysiolPharmacol. 44(3), 329-334.
- 40.Mohanty S P, Babu S S, Nair N S. (2001) The use of arm span as a predictor of height. , A study of South Indian 9(1).
- 41.Ter Goon D, Toriola A T, Musa D I, Akusu S. (2011) The relationship between arm span and stature in. , Nigerian 43(1), 38-43.
- 42.Jarzem.. PF,Gledhill RB .(1993) Predicting height from arm measurements.JPediatrOrthop.13(6) 761-65.
- 43.Hirani V.Mindell J.(2008)A comparison of measured height and demi-span equivalent heightin the assessment of body mass index among people aged 65 years and over in England.Age Ageing.37(3). 311-7.
- 44.Sorkin J D, Muller D C, Andres R. (1999) Longitudinal change in the heights of men and women: consequential effects on body mass. 21(2), 247-60.
- 45.Ismail S.Manandhar M (eds).(1999) Better Nutrition for Older People Assessment and Action.Help Age International. , Saffron Hill, London.http://www.unsystem.org/scn/archives/scnnews19/ch22.htm 67-74.
- 46.Reeves S L, Varakamin C, CJK Henry. (1996) The relationship between arm-span measurement and height with special reference to gender and ethnicity.EurJClinNutr.50. 398-400.
- 47.Steele M F, Chenier T C. (1990) Arm-span, height, and age in black and white women.Ann Hum Biol.17(6). 533-41.
- 48.James W P.Ferro Luzzi A,Waterlow JC .(1988) Definition of chronic energy deficiency in adults. Report of a Working Party of the International Dietary Energy Consultative Group.EurJClinNutr.42 969-981.
- 50.Shahar S, Pooy N S. (2003) Predictive equations for estimation of stature in Malaysian elderly people. , Asia Pac 12(1), 80-84.
- 51.Kwok T, Woo J, Lau E. (2001) Prediction of body fat by anthropometry in. , Older Chinese 9(2), 97-101.
- 52.Popovic S, Bjelica D, Tanase G D, Milasinovic R. (2015) Body Height and Its Estimation Utilizing Arm Span Measurements. in Bosnian and Herzegovinian Adults.MontenJ Sports Sci Med 1, 29-36.
- 53.Perissinotto E, Pisent C, Sergi G, Grigoletto F, Enzi G. (2002) Anthropometric measurements in the elderly: age and gender differences.Br. 87-177.
- 54.Sampaio L R, Figueiredo V C.(2005)Correlation between body mass index and body fat distribution anthropometric indices in adults and the elderly.RevNutr.18,53-61.
- 55.Dey D K, Rothenberg E, Sundh V.Bosaeus I,Steen B.(1999) Height and body weight in the elderly 1999 A 25- year longitudinal study of a population aged. 70-95.
- 56.Nishiwaki Y, Michikawa T, Eto N, Takebayashi T. (2011) Body mass index misclassification due to kyphotic posture in Japanese community-dwelling adults aged 65 years and older. JGerontolSeries A.BiolSci Med Sci.66(3),326-31.
- 57.Costa BV SiqueiraVdeO, Lopes A C, Santos L C.Lima-Costa MF,CaiaffaWT.(2012) Different equations for determining height among the elderly: the Bambui Cohort Study of Aging.CadSaudePublica.28(1),125-34.
Cited by (11)
This article has been cited by 11 scholarly works according to:
Citing Articles:
MRIMS Journal of Health Sciences (2025) Crossref Semantic Scholar OpenAlex
Okwan Daniel Kobina, Abaidoo Chrissie Stansie, Wepeba Pet-Paul, Robertson Juliet, Bempah Samuel Kwadwo Peprah et al. - Journal of Forensic Science and Research (2025) Semantic Scholar Crossref OpenAlex
A. O. Adebajo, G. B. Ojo, K. P. Adebajo, J. H. Ojo, O. H. Ayoade et al. - Discover Psychology (2024) Semantic Scholar Crossref OpenAlex
medRxiv (Cold Spring Harbor Laboratory) (2024) OpenAlex
Research Square (Research Square) (2023) OpenAlex
The Turkish Journal of Pediatrics (2023) OpenAlex
H. Yisak, I. Maru, Misganaw Abie, Getachew Arage, A. Ewunetei et al. - BMJ Open (2022) Semantic Scholar Crossref OpenAlex
Amitav Sarma, B. Barman, G. Das, H. Saikia, Ambath D. Momin - Journal of Family Medicine and Primary Care (2020) Semantic Scholar Crossref OpenAlex
Pakistan Journal of Nutrition (2020) Crossref OpenAlex
Miguel Germán Borda, C. Cano-Gutierrez, María Juliana Lozano, Samir Aruachán, Nicolás Castellanos-Perilla et al. - (2019) Semantic Scholar
N. Arlappa, N. Balakrishna, S. B. Kokku, R. Harikumar, Kodavanti Mallikharju et al. - (2016) Semantic Scholar Crossref OpenAlex