
Low Energy Intake Impairs Glucose Regulation and Stamina in Japanese Young Women
Abstract
Energy intake has been decreasing these ten years in Japan, and low energy intake is remarkable especially among young women. We attempted to show the dietary habits and physiological function including glucose tolerance and stamina for endurance-running in contemporary young Japanese women who take insufficient energy. 85 healthy women aged 20.5±1.1 years were enrolled in the present study. Subjects were categorized in two groups; Group I (n=70) with higher energy intake, and Group II (n=15) with lower energy intake than the basal metabolic rate (BMR). Actual energy intake in Group I was 1598.8±282.1 kcal/day, and it was 1019.9±127.1 kcal/day in Group II (p<0.01). Standard 75-g oral glucose-tolerance test was performed, and the capillary glucose value was measured at the fingertip. In Group I, glucose values at fasting, 30, 60 and 120 min were 75.0±9.1, 132.1±25.2, 120.5±27.4, 105.3±19.5 mg/dl, and those in Group II were 78.9±7.7, 155.8±26.6, 142.2±26.6, 112.3±16.0 mg/dl, respectively. The values of Group II at 30 and 60 min showed significantly high (p< 0.01). Stamina and the intake of protein in Group II were significantly lower than those in Group I (p<0.05), and muscle mass and grip strength were less in Group II than in Group I, though there was no significant difference. We indicated with these results that low skeletal muscle was considered to be responsible for the impairment of glucose regulation in Group II. This study showed that young women with low energy intake should take sufficient energy and build skeletal muscle to prevent the impairment of glucose regulation.
Author Contributions
Academic Editor: Derek Ball, Heriot-Watt university
Checked for plagiarism: Yes
Review by: Single-blind
Copyright © 2016 Michiyo Kaneko, et al.
 This is an open-access article distributed under the terms of the Creative Commons Attribution License, which permits unrestricted use, distribution, and reproduction in any medium, provided the original author and source are credited.
Competing interests
The authors have declared that no competing interests exist.
Citation:
Introduction
According to the statistics published by the Ministry of Health, Labour and Welfare of Japan in 2013, average energy intake of Japanese had decreased since 1995, and low energy intake has been remarkable especially among young women these ten years 1. The energy intake by those who were 20~29 year old in 2013 was 1,628 kcal 1. Moreover, our preliminary investigation showed that about 20% of young women were taking energy even under basal metabolic rate (BMR) because of their strong desire for thinness 2. van Abeelen et al. reported that undernutrition in the youth caused the risk of pulmonary disease, coronary artery calcification and the higher risk of type 2 diabetes later in adulthood 3, 4, 5. Most serious effect among these is the impairment of glucose tolerance and type 2 diabetes 6, 7 which would be one of the pathogenic factors for atherosclerosis leading to mortal cardiovascular disease 8, 9, 10, 11.
In addition, some of the young women might become pregnant in the near future and adequate nutrition is required for development of fetus. Many studies in human and animals reported that the adverse effects of prenatal malnutrition on the development of brain function, hypertension, metabolic syndrome in the adulthood 12, 13, 14, 15. In order to supply sufficient nutrients to the embryo, it is required for young women to have proper dietary habits and take sufficient nutrients for having healthy offspring. It is, therefore, of critical challenge for us to investigate the actual nutritional status in contemporary Japanese young women.
In the present study, we examined the dietary habits, and the effects of low energy intake on physiological function including glucose tolerance and stamina for endurance-running in young women who took insufficient energy. We hope that the results of this study would encourage young women to take sufficient nutrients and energy, and would contribute to the formulation of nutrition education policy in Japan and other countries in similar situation.
Methods
We carried out this study in accordance with the Declaration of Helsinki. This study was approved and carried out according to the guidelines of the ethics committee of human research of Kobe Women’s University. Subjects gave written consent to participate in the study. This study was carried out in 2015.
Subjects and Body Composition
85 healthy young women aged 20.5±1.1 years were enrolled in the present study who were university students mostly from Kansai region of Japan. Body composition including muscle mass, estimated bone mass, body fat percentages were measured by impedance method (BC-716, TANITA Corp., Tokyo, Japan). Grip strength was measured by the squeeze dynamometer.
Measurement of Vascular Age
Vascular aging was evaluated by the second derivative of photoplethysmogram (SDPTG) at fingertip 16, 17, 18. The subject put the right forefinger on the devise for about 20 seconds. The machine, the BC Checker Ver.10.00 (Future Wave, Inc., Tokyo, Japan), measured the amount of light absorbed by hemoglobin reflecting blood flow, and analyzed SDPTG wave form of the fingertip which reflects arterial stiffness. The machine showed the vascular age.
Glucose-Tolerance Test
Standard 75-g oral glucose-tolerance test(OGTT) was performed at the fingertip, and capillary glucose values were measured at fasting without any food for 10 hours before measurement, and 30, 60, and 120 min followed by drinking of 75g glucose in 225 ml water.
Nutrition Intake
Brief-type self-administered diet history questionnaire (BDHQ) was conducted for analyzing food and energy intakes 19, 20, 21. The subjects were requested to answer the questionnaires which contain the kinds of food, amount and the frequency the subjects had for the previous one month of the investigation. 4 page sheets filled by each subject were sent to the EBN JAPAN (DHQ Support Center, Tokyo, Japan) which analyzed energy intake, nutrient intake, kind of food and amount of food for one month.
Stamina Test
Stamina was estimated by the method developed by Shindo in Japan 22. Subjects were walking or running at the speed of 4 stages from 40 sec/100m to 85 sec/100m. At the stage of each speed, subjects were running for about 4 minutes constantly, and then counted the pulse rate for 15 seconds just after stopping. After subjects counted pulse rate at each speed, they plotted 4 dots on the special graph sheets made by Shindo with the speed in the vertical direction and pulse rate in the lateral direction. We made the regression line on each graph, and evaluated the speed (sec/100m) at 125 pulse rate/min equivalent to 50%VO2max for 20 year old persons. By carrying out this test, called “simplified Stamina-Test”, we estimated the subjects’ stamina. Low speed at 125 pulse rate/min was considered low stamina.
Statistical Analysis
Food groups and nutritional values were compared between the two groups. Two-tailed student’s t-test, followed by the F-test checking variance, was performed. Statistical analysis in OGTT was carried out by the simple main effect at each time point followed by the two way ANOVA of the repeated measure general linear model. Post-hoc analysis was performed by Bonferroni using the software of SPSS. p<0.05 was considered significant difference.
Results
Energy Intake
15 subjects out of 85 participants (17.6%) were taking energy under BMR calculated by Harris-Benedict Equation. Subjects were categorized in two groups; Group I (20.5±1.2 years old, n=70) with higher energy intake, and Group II (20.5±1.0 years old, n=15) with lower energy intake than BMR. As shown in Table 1, actual energy intake in Group I was 1598.8±282.1 kcal/day, and it was 1019.9±127.1 kcal/day in Group II, and there was significant difference (p<0.001). However, the BMR value calculated by Harris-Benedict Equation in each group was 1290.1±80.4 kcal/day in Group I, 1282.0±48.7 kcal/day in Group II, and there was no significant difference. The body mass indexes (BMI) of both groups (Group I; 20.7±2.7 kg/m2, Group I; 21.1±1.2 kg/m2) were in the normal range and there was no significant difference between the two groups.
Table 1. Age, body mass index (BMI), actual energy intake and basal metabolic rate (BMR) calculated Harris-Benedict Equation| Group Ⅰ n=70 | Group Ⅱ n=15 | |||||
| Age | 20.5 | ± | 1.2 | 20.5 | ± | 1 |
| BMI (kg/m2) | 20.7 | ± | 2.7 | 21.1 | ± | 1.2 |
| Energy intake (kcal/day) | 1598.8 | ± | 282.1 | 1019.9 | ± | 127.1* |
| Basal metabolic rate (kcal/day) | 1290.1 | ± | 80.4 | 1282 | ± | 48.7 |
Glucose Metabolism
Standard 75-g oral glucose-tolerance test was performed, and the glucose values at the fingertip were measured at fasting, and 30, 60, and 120 min after glucose loading (Figure 1). The blood glucose level at 30 min in Group II was significantly higher than that in Group I (155.8±26.6 mg/dl vs 132.1±25.2 mg/dl, p=0.002) showing the steep increase of blood glucose level from the fasting level in Group II. At 60 min, it was also significantly higher in Group II than in Group I (142.2±26.6 mg/dl vs 120.5±27.4 mg/dl, p=0.007). On the other hand, blood glucose values at fasting in both groups (78.9±7.7 mg/dl vs 75.0±9.1 mg/dl) were similar. The value in Group II at 120 min post-loading was 112.3±16.0 mg/dl and 105.3±19.5 mg/dl in Group I.
Figure 1.Glucose values at fingertip measured at fasting and 30, 60, 120min after glucose loading.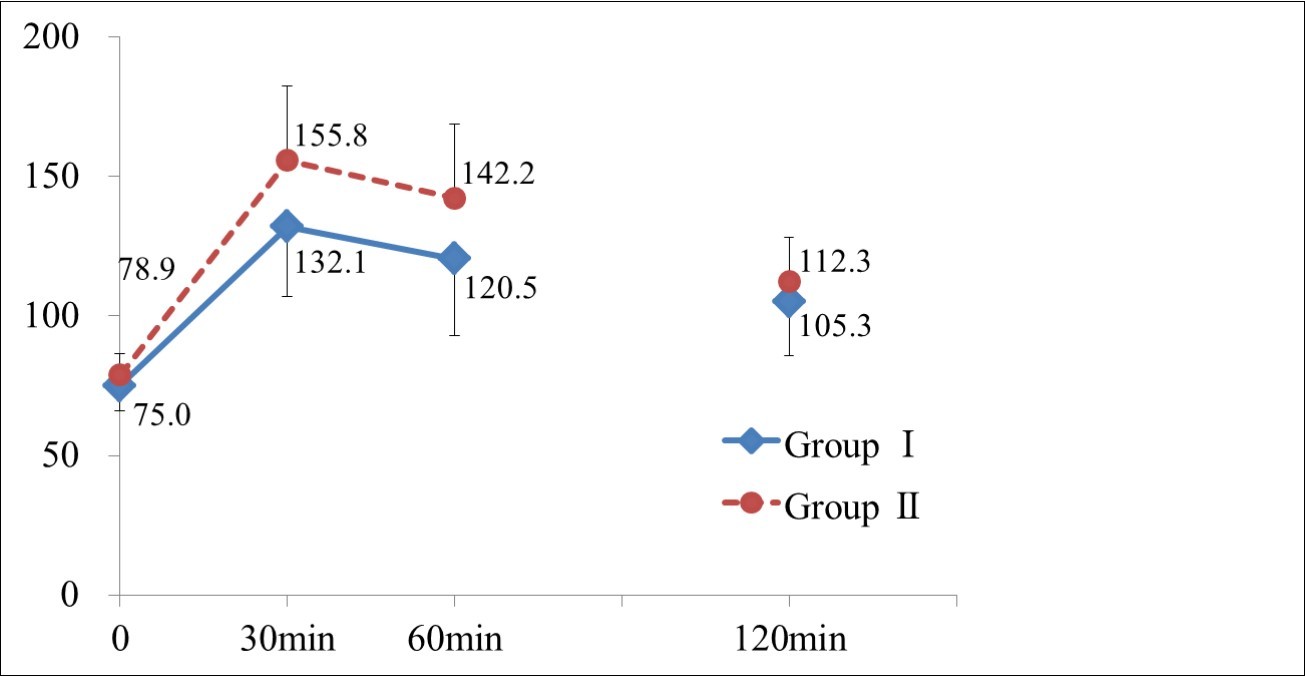
Values are mean ± S.D.
*: Significant difference between two groups (p <0.05)
Body Composition and stamina test
Table 2 shows stamina for endurance-running in the two groups. Running speed at 125 pulse rate/min in Group I was 56.0±8.9 sec/100m, and the speed in Group II was 61.8±11.8 sec/100m which was significantly slower than that in Group I (p<0.05). This result means that stamina in Group I was significantly stronger than in Group II. There was no significant difference between the two groups in grip strength (26.4±4.2 kgw vs 24.0±3.4 kgw), and in muscle mass (35.2±2.9 kg vs 34.7±2.5 kg). Estimated bone mass and body fat percentage in both groups were similar. Vascular ages in both groups were almost the same.
Table 2. Muscle mass, estimated bone mass, body fat percentage, grip strength, stamina for running and vascular age.| Group 1 | Group 2 | |||||
| Muscle (kg) | 35.2 | ± | 2.9 | 34.7 | ± | 2.5 |
| Estimated bone mass (kg) | 2.12 | ± | 0.29 | 2.06 | ± | 0.24 |
| Body fat percentage (%) | 27.8 | ± | 5.2 | 28.7 | ± | 2.5 |
| Grip strength (kgw) | 26.4 | ± | 4.2 | 24 | ± | 3.4 |
| Stamina (sec/100m) | 56.0 | ± | 8.9 | 61.8 | ± | 11.8* |
| Vascular age | 20.1 | ± | 0.6 | 20.0 | ± | 0 |
Nutrient Intake
In spite of the fact that Group I had significantly higher intake of protein (57.2±12.0 g/day), fat(50.3±10.5 g/day) and carbohydrate (218.9±55.9 g/day) than Group II (36.5±8.6 g/day, 32.5±9.5 g/day, 136.8±24.7 g/day, respectively), the balance of energy taken from protein, fat and carbohydrate was similar (Figure 2). Intake of all the other nutrients, minerals, saturated fatty acid, monosaturated fatty acid, polysaturated fatty acid, n-3 fatty acid, n-6 fatty acid, cholesterol and dietary fiber in Group I showed significantly higher than those in Group II (p<0.05) (Table 3).
Figure 2.The balance of energy intake from protein, fat and carbohydrate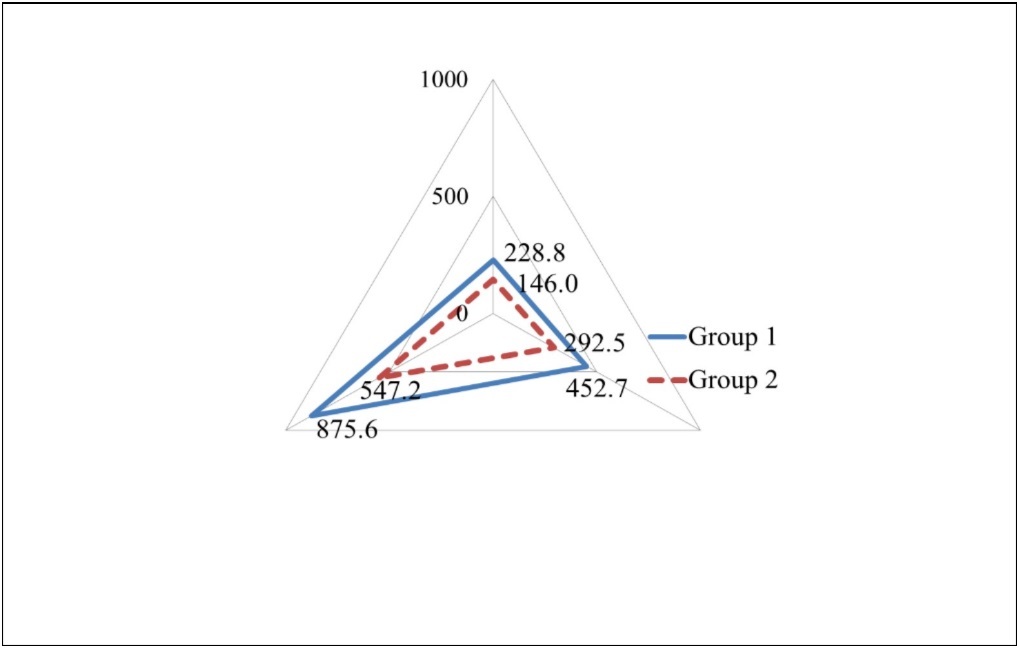
| Group 1 | Group 2 | |||||
| Protein (g/day) | 57.2 | ± | 12.0 | 36.5 | ± | 8.6* |
| Fat (g/day) | 50.3 | ± | 10.5 | 32.5 | ± | 9.5* |
| Carbohydrate (g/day) | 218.9 | ± | 55.9 | 136.8 | ± | 24.7* |
| Mineral (g/day) | 14.0 | ± | 3.0 | 9.4 | ± | 2.0* |
| Saturated fatty acid (g/day) | 14.2 | ± | 3.7 | 9.6 | ± | 3.6* |
| Monounsaturated fatty acid (g/day) | 18.2 | ± | 4.0 | 11.6 | ± | 3.4* |
| Poly unsaturated fatty acid (g/day) | 11.5 | ± | 2.7 | 7.2 | ± | 1.9* |
| n-3 fatty acid (g/day) | 2.1 | ± | 0.6 | 1.2 | ± | 0.4* |
| n-6 fatty acid (g/day) | 9.3 | ± | 2.1 | 5.9 | ± | 1.6* |
| Cholesterol (mg/day) | 359.0 | ± | 104.7 | 242.5 | ± | 101.4* |
| Dietary fiber (g/day) | 9.5 | ± | 3.6 | 5.9 | ± | 2.0* |
Food Intake
Table 4 shows the amount of food in each group. Group I had a significantly higher intake (p< 0.05) of cereals (Group I; 370.3±148.9 g/day, Group II ; 229.1±84.8 g/day), green and yellow vegetables(Group I; 91.4±71.5 g/day, Group II; 49.1±30.4 g/day), other vegetables (Group I; 137.2±74.3 g/day, Group II ; 75.9±43.0 g/day), oils and fats (Group I;10.6±4.0 g/day, Group II ; 6.8±3.3 g/day), seafood (Group I; 51.8±27.9 g/day, Group II ; 25.9±18.4 g/day), meats(Group I; 67.6±29.4 g/day, Group II ; 44.1±18.3 g/day), eggs (Group I; 41.4±20.1 g/day, Group II ; 29.8±19.8 g/day), fruits (Group I; 79.1±60.7 g/day, Group II ; 45.8±27.5 g/day) and sweets (Group I; 46.6±31.0 g/day, Group II ; 27.4±15.7 g/day). There was no significant difference between the two groups in the intake of tubers, beans, dairy and sugar.
Table 4. Intake of food groups in both groups.| Group 1 | Group 2 | |||||
| Cereals (g/day) | 370.3 | ± | 148.9 | 229.1 | ± | 84.8* |
| Tubers (g/day) | 42.6 | ± | 44.1 | 34.3 | ± | 30.5 |
| Green and yellow vegetables (g/day) | 91.4 | ± | 71.5 | 49.1 | ± | 30.4* |
| Other vegetables (g/day) | 137.2 | ± | 74.3 | 75.9 | ± | 43.0* |
| Oils and fats (g/day) | 10.6 | ± | 4.0 | 6.8 | ± | 3.3* |
| Beans (g/day) | 42.1 | ± | 34.7 | 26.2 | ± | 23.6 |
| Seafood (g/day) | 51.8 | ± | 27.9 | 25.9 | ± | 18.4* |
| Meats (g/day) | 67.6 | ± | 29.4 | 44.1 | ± | 18.3* |
| Eggs (g/day) | 41.4 | ± | 20.1 | 29.8 | ± | 19.8* |
| Dairy (g/day) | 118.6 | ± | 94.3 | 105 | ± | 73.0 |
| Fruits (g/day) | 79.1 | ± | 60.7 | 45.8 | ± | 27.5* |
| Sugar (g/day) | 4.3 | ± | 3.7 | 3.2 | ± | 2.5 |
| Sweets (g/day) | 46.6 | ± | 31.0 | 27.4 | ± | 15.7* |
Discussion
We showed that 17.6% of subjects in this study were taking extremely low energy even under BMR. In spite of taking very low energy in Group II, they showed normal range of BMI. This phenomenon could be explained by two reasons. Firstly, the amount of physical activities of the subjects in Group II might have been low. Secondary, the subjects in Group II in the normal range of BMI were trying to reduce weight by lowering food intakes with strong desire for thinness. If they would continue the dietary habits of low energy intake for a long time, BMI would be lower and the subjects in Group II would definitely become slender. We would emphasize that some serious problems are hidden behind normal BMI. Low BMI would have higher risk of having low weight birth babies 23, 24, and their glucose regulation would be impaired in their adulthood leading to type 2 diabetes 25, 26. These reports suggested that young women should have adequate dietary habits and sufficient energy for healthy offspring.
Very serious physiological problem with very low energy intake is the impairment of glucose regulation. In general, the definition of diabetes is that glucose level at 120 min after glucose loading is over 200 mg/dl. In our results, glucose level measured at 120 min in Group II was 112.3 mg/dl. However, blood glucose levels of Group II at 30 and 60 min after glucose loading were significantly high showing steep increase from 78.9 mg/dl at fasting to 155.8 mg/dl at 30 min. Some reports have shown that the large fluctuation of blood glucose level impaired endothelial function and the acute glucose fluctuations triggered oxidative stress leading to endothelial cell apoptosis more severe than even stable hyperglycemia 27, 28, 29. It was also reported that the swings in blood glucose level accelerated atherogenesis 30. These reports suggested that young women with low energy intake in our study might have the higher risk of atherosclerosis leading to mortal cardiovascular disease in their later lives 8, 9, 10, 11.
Our result showed that stamina for endurance-running was significantly low in Group II. It indicated that subjects in Group II did not have much enough muscle for endurance in running. Actually muscle mass and grip strength were slightly less in Group II. Generally speaking in elderly individuals, low skeletal muscle, occasionally caused by less intake of protein 31, 32, would be mainly responsible for postprandial glucose disposal and would be also associated with insulin resistance leading to type 2 diabetes 33, 34. Therefore, low skeletal muscle, sarcopenia in older ages, was significantly associated with type 2 diabetes 35, 36. In our study, subjects were not older persons but young women of 20.5±1.1 years. But still we could assume that the impairment of glucose regulation in Group II was because of the insufficiency of skeletal muscle for the consumption of glucose after glucose loading just the same as shown in sarcopenia in elderly. Less skeletal muscle in Group II could be considered the reason for the blood glucose level at 30 and 60 min to be significantly high.
Concerning the dietary habits, the intake of all kinds of nutrients in Group II was significantly less than in Group I. The major problem is the deficiency of protein from meats, seafood and eggs which would lead to low skeletal muscle mass 31, 32. We need to measure skeletal muscle mass and function using leg dynamometer to confirm this hypothesis in the next study.
Since vascular age in both groups were almost same as their actual age, it can be considered that atherosclerosis in Group II was not progressed. However, the big fluctuation of blood glucose level shown in Group II posed the higher risk of atherosclerosis leading to mortal cardiovascular disease 8, 9, 10, 11. This study showed that young women with low energy intake should take sufficient energy and build skeletal muscle to prevent the impairment of glucose regulation.
Conclusion
Our study showed that 17.6% of young women who participated in this study were taking energy even under BMR. The subjects with low energy intake impaired glucose regulation and their stamina was significantly low. The impairment of glucose regulation could be considered to be due to less energy intake.
Acknowledgements
We thank the students who participated in this study as subjects. This study was supported by a research grant from Kobe Women’s University.
References
- 2.Hayashi F, Takimoto H, Yoshita K, Yoshiike N. (2006) Perceived body size and desire for thinness of young Japanese women: a population-based survey. , Br J Nutr 96(6), 1154-1162.
- 3.van Abeelen AF, Elias S G, de Jong PA, Grobbee D E, Bossuyt P M.(2013)Famine in the young and risk of later hospitalization for COPD and asthma. PLoS One;8(12):e82636
- 4.Idris N S, Uiterwaal C S, YT van der Schouw, van Abeelen AF.(2013)Famine in childhood and postmenopausal coronary arterycalcification: a cohort study. , BMJ Open;3(11):e003818
- 5.Fransen H P, Peeters P H, Beulens J W, Boer J M, de Wit GA. (2016) Exposure to Famine at a Young Age and Unhealthy Lifestyle Behavior Later in Life. PLoS One; 11(5):e0156609
- 6.van Abeelen AF, Elias S G, Bossuyt P M, Grobbee D E, YT van der Schouw. (2012) Famine exposure in the young and the risk of type 2 diabetes in adulthood. , Diabetes; 61(9), 2255-2260.
- 7.Lumey L H, Khalangot M D, Vaiserman A M. (2015) Association between type 2 diabetes and prenatal exposure to the Ukraine famine of 1932-33: a retrospective cohort study. Lancet Diabetes Endocrinol;. 3(10), 787-794.
- 8.Haffner S M, Lehto S, Rönnemaa T, Pyörälä K, Laakso M. (1998) Mortality from coronary heart disease in subjects with type 2 diabetes and in nondiabetic subjects with and without prior myocardial infarction. , N Engl J Med; 339(4), 229-234.
- 9.Kannel W B, McGee D L. (1979) Diabetes and glucose tolerance as risk factors for cardiovascular disease: the Framingham study. Diabetes Care;. 2(2), 120-126.
- 10.Pyörälä K, Laakso M, Uusitupa M. (1987) Diabetes and atherosclerosis: an epidemiologic view. , Diabetes Metab 3(2), 463-524.
- 11.Stamler J, Vaccaro O, Neaton J D, Wentworth D. (1993) Diabetes, other risk factors, and 12-yr cardiovascular mortality for men screened in the Multiple Risk Factor Intervention Trial. Diabetes Care;. 16(2), 434-444.
- 12.Prado E L, Dewey K G. (2014) Nutrition and brain development in early life. , Nutr 72(4), 267-284.
- 13.Morgane P J, Austin-LaFrance R, Bronzino J, Tonkiss j, Diaz-Cintra S. (1993) Prenatal malnutrition and development of the brain. , Neurosci Biobehav 17(1), 91-128.
- 14.DS1 Gardner, Pearce S, Dandrea J, Walker R, Ramsay M M et al. (2004) Peri-implantation undernutrition programs blunted angiotensin II evoked baroreflex responses in young adult sheep. , Hypertension; 43(6), 1290-1296.
- 15.Li Y, Jaddoe V W, Qi L, He Y, Wang D. (2011) Exposure to the Chinese famine in early life and the risk of metabolic syndrome in adulthood. , Diabetes 34(4), 1014-1018.
- 16.Bortolotto L A, Blacher J, Kondo T, Takazawa K, Safar M E. (2000) Assessment of vascular aging and atherosclerosis in hypertensivesubjects: second derivative of photoplethysmogram versus pulse wave velocity. , Am J Hypertens; 13(2), 165-171.
- 17.Takazawa K, Tanaka N, Fujita M, Matsuoka O, Saiki T. (1998) Assessment of vasoactive agents and vascular aging by the second derivative of photoplethysmogram waveform. , Hypertension; 32(2), 365-370.
- 18.Takazawa K, Fujita M, Yabe K, Sakai T, Kobaayashi T. (1993) Clinical usefulness of the second derivative of a plythysmogram (Acceleration plethysmogram). , J Cardiol; 23, 207-217.
- 19.Murakami K, Sasaki S, Takahashi Y, Okubo H, Hirota N. (2008) Reproducibility and relative validity of dietary glycaemic index andload assessed with a self-administered diet-history questionnaire in Japanese adults. , Br J Nutr; 99(3), 639-648.
- 20.Kobayashi S, Murakami K, Sasaki S, Okubo H, Hirota N. (2011) Comparison of relative validity of food group intakes estimated by comprehensive and brief-type self-administered diet history questionnaires against 16d dietary records in Japanese adults. , Public Health Nutr; 14(7), 1200-1211.
- 21.Sasaki S, Yanagibori R, Amano K. (1998) Self-administered diet history questionnaire developed for health education: a relative validation of the test-version by comparison with3-day diet record in women. , J Epidemiol; 8(4), 203-215.
- 22.Kawagisi Y. (1990) Reconsideration of the physical fitness and motor ability test (1): A review, and the relationship between the measurements of the Endurance-Run and the simplified Stamina-Test. (Abstract in English) , Gifu University Institutional Repository; 26, 103-116.
- 23.Ronnenberg A G, Wang X, Xing H, Chen C, Chen D. (2003) Low preconception body mass index is associated with birth outcome in a prospective cohort of Chinese women. , J Nutr; 133(11), 3449-3455.
- 24.Yu Z, Han S, Zhu J, Sun X, Ji C. (2013) Pre-pregnancy body mass index in relation to infant birth weight and offspring overweight/obesity: a systematic review and meta-analysis. PLoS One; 8(4):e61627
- 25.Hovi P, Andersson S, Eriksson J G, Järvenpää A L, Strang-Karlsson S. (2007) Glucose regulation in young adults with very low birth weight. , N Engl J Med; 356(20), 2053-2063.
- 26.Phillips D I, Barker D J, Hales C N, Hirst S, Osmond C. (1994) Thinness at birth and insulin resistance in adult life. , Diabetologia; 37(2), 150-154.
- 27.Torimoto K, Okada Y, Mori H, Tanaka Y. (2013) Relationship between fluctuations in glucose levels measured bycontinuous glucose monitoring and vascular endothelial dysfunction in type 2 diabetes mellitus. , Cardiovasc Diabetol; 12, 1.
- 28.Monnier L, Mas E, Ginet C, Michel F, Villon L.(2006)Activation of oxidative stress by acute glucose fluctuations compared with sustained chronic hyperglycemia in patients with type 2 diabetes. , JAMA; 295(14), 1681-1687.
- 29.Risso A, Mercuri F, Quagliaro L, Damante G, Ceriello A. (2001) Intermittent high glucose enhances apoptosis in human umbilical vein endothelial cells in culture. , Am J Physiol Endocrinol Metab; 281-5.
- 30.Mita T, Otsuka A, Azuma K, Uchida T, Ogihara T. (2007) Swings in blood glucose levels accelerate atherogenesis inapolipoprotein E-deficient mice. , Biochem Biophys Res Commun: 358(3), 679-685.
- 31.Loenneke J P, Loprinzi P D, Murphy C H, Phillips S M. (2016) Per meal dose and frequency of protein consumption is associatedwith lean mass and muscle performance. Clin Nutr. 0261-5614.
- 32.Isanejad M, Mursu J, Sirola J, Kröger H, Rikkonen T. (2016) Dietary protein intake is associated with better physical function and muscle strength among elderly women. , Br J Nutr; 115(7), 1281-1291.
- 33.Cleasby M E, Jamieson P M, Atherton P J. (2016) Insulin resistance and sarcopenia: mechanistic links between common co-morbidities. , J Endocrinol; 229(2), 67-81.
- 34.Srikanthan P, Hevener A L, Karlamangla A S. (2010) Sarcopenia exacerbates obesity-associated insulin resistance anddysglycemia: findings from the National Health and Nutrition Examination Survey III. PLoS One; 5(5):e10805
Cited by (1)
This article has been cited by 1 scholarly work according to:
Citing Articles:
International Journal Of Nutrition (2016) OpenAlex