
Relationship Between Household Economic Status and Childhood Micronutrient Deficiency in India: An Evidence from a National Level Representative Survey
Abstract
The high prevalence of anemia among children and adolescents in India is still an overwhelming problem. Not only that, there is also a considerable deficiency of various micronutrients such as Vitamin A, Vitamin B12, Vitamin D, serum ferritin, Zinc and Folate etc. in children. These micronutrients have several functional roles for the normal growth and development of children. Unfortunately, recent studies on public health and nutrition intervention have so far focused less on these micronutrition and more on anemia and nutrition.
Data for this study obtained from the Comprehensive National Nutrition Survey (CNNS 2016-18), a nationally representative survey covering different age group. Specifically, it includes information on 9767 children aged 1-4 years. Out of these surveyed children biomarker data for hemoglobin, serum ferritin, zinc, folate, vitamin A, vitamin B12 and Vitamin D were collected from 8242 children. Micronutrient deficiencies were identified based on WHO and other established cut-off criteria. Wealth quintiles were computed to identify household economic inequality. The prevalence of anemia at the national level was 40.7%. Among micronutrients, folate (22.9%) and zinc (18.7%) deficiencies were most commonly observed, followed by vitamins A (18.3), vitamin B12 (13.8%) and vitamin D (14.0%). Iron deficiency as measured by ferritin was present in 31.6% of children.
It is alarming that nearly one in three children (32.8%) suffer from deficiencies in two or more micronutrients. Clear socioeconomic disparities were observed for all micronutrient deficiencies (MND); children in the poorest groups had significantly higher levels of micronutrient deficiencies than children in the richest groups. Among the states, Gujarat and Madhya Pradesh had the highest overall micronutrient deficiencies, while West Bengal and Kerala had the lowest. This clearly shows that a large proportion of preschool children in India suffer from anemia and MND, with the prevalence being even more alarming in lower socio-economic settings.
This study suggests that there is a need to move beyond single-nutrient interventions and implement comprehensive, multi-micronutrient supplementation or food fortification strategies seamlessly into the existing national health and nutrition programs.
Article Information
- Received
- Accepted
- Published
Academic Editor: Loai Aljerf, Department of Life Sciences, Faculty of Dentistry, University of Damascus.
Checked for plagiarism: Yes
Review by: Single-blind
Copyright © 2026 Atanu Ghosh, et al.
 This is an open-access article distributed under the terms of the Creative Commons Attribution License, which permits unrestricted use, distribution, and reproduction in any medium, provided the original author and source are credited.
Corresponding author: Samiran Bisai, Public Health Nutrition Research Unit, Department of Anthropology & TS, Sidho, Kanho Birsha University, Purulia, West Bengal, India —
Competing Interests
The author declares that there is no conflict of interest.
Funding
No specific funding statement was provided by the authors.
Data Availability
No data-availability statement was provided by the authors.
Citation:
Introduction
Childhood anemia poses a significant public health challenge among children under five years of age in India, with the prevalence estimated at 58.5% according to recent national survey 1. The consequences are very serious, including impaired cognitive and motor development, reduced immunity and reduced physical capacity, which collectively have a negative impact on educational performance and future economic productivity 2, 3. For decades, public health interventions efforts to combat anemia have predominantly focused on iron deficiency 4. However, the pathological landscape of childhood anemia is complex and often not caused by a single nutrient deficiency. Large numbers of literature suggests that deficiencies of other micronutrients, including vitamin A, vitamin B12, folate, zinc and vitamin D, are not only widespread but also significantly contribute to the etiology of anemia and have independent adverse effects on child health 5, 6, 7. For instance, vitamin A is essential for erythropoiesis and iron mobilization 8, vitamin B12 and folate are vital for DNA synthesis in red blood cell precursors 9 and zinc deficiency can compromise immunity and growth, indirectly exacerbating the burden of infection-related anemia 10. Additionally researches have indicated a potential role for vitamin D in regulating hepcidin and inflammation, thereby influencing iron metabolism 11, 12.
The World Health Organization (WHO) defines ‘Micronutrients’ as compounds needed in very smaller amounts, less than100 mg/d 13. Minerales and vitamins are examples of Micronutrients. They are essential for the production of hormones, enzymes, and other substances that regulate growth and development 14. "Hidden Hunger" or "Micronutrient Malnutrition" can have detrimental consequences that include mental illness, learning impairment, stunted growth, poor health, early death and lassitude.
The co-existence of two or more micronutrient deficiencies is known as multiple micronutrient deficiencies (MMNDs). Synergistic interactions among these deficiencies may exacerbate overall health consequences beyond the effects of any one deficiency 15. This overlapping burden arises primarily from the combined effects of poverty, inadequate nutrition and high prevalence of infectious diseases 6. Household poverty limits access to a variety of nutritious foods, leading to deficiencies in essential vitamins and minerals 7. Poverty is also associated with poor sanitation and poor living conditions, which increase the risk of diarrhea and respiratory diseases 8, 16. These infections act as biological amplifiers of mal nutrition by suppressing appetite, obstructing nutrient absorption and elevating metabolic losses, thereby aggravating existing deficiencies and perpetuating a vicious cycle that is difficult to break 9, 10.
A study conducted by Houghton et.al (2019) in Delhi slum found that over half of the children (57%) aged 12-23 months were suffering from three or more micronutrients, with the highest incidence among children from poor families 17. However, research related to anemia and its coexistence with micronutrient deficiencies at the national level in India remains limited and insufficient.
Socioeconomic status (SES) is recognised as a major determinant of nutrition and micronutrient status. Children from low-income families are at risk of malnutrition due to food insecurity, poor dietary diversity, inadequate sanitation, and limited access to healthcare 18, 19. Understanding the relationship between economic status and micronutrient deficiency is crucial for targeted public health interventions.
The Comprehensive National Nutrition Survey (CNNS 2016-18) offers a valuable opportunity to address this gap through providing national level representative data. For the first time in India, this survey collected biochemical data on micronutrients from a nationally representative sample, allowing for the simultaneous measurement of the burden of anemia and MND. Therefore, the objectives of this study are: 1) To present the prevalence of iron, zinc, vitamin A, vitamin B12, folate and vitamin D deficiencies among children aged 1-4 years in India; 2) To highlight how multiple micronutrient deficiencies differ across socioeconomic classes.
Methods
Study Population and Design
Unit level data of Comprehensive National Nutrition Survey (CNNS) 2016-18 have been analysed for this study. This nationally representative cross-sectional survey was carried out jointly by the Ministry of Health and Family Welfare, Government of India, UNICEF and the Population Council. This survey collected representative data from all 30 states of India.
The survey collected data from three destined population groups: 0-4 years, 5-9 years and adolescents 10-19 years. In the current study we have extracted and analyse data on pre-school children aged 1-4 years. There were 9767 children in this age group out of which micronutrient biomarkers related data was available for 8242 children. The survey have also collected data on different socio-economic characteristics of the households and mother or primary caregivers of the child.
Written consent was obtained from the parents/guardians of each child whose information was collected in this survey. The study protocol was approved by the Institutional Ethical Review Board of the Post Graduate Institute of Medical Education and Research (PGIMER), Chandigarh. Blood sample was collected through trained phlebotomists and analysed through strict quality control protocols.
Sociodemographic information and Wealth Index
This study collected data on different socio demographic characteristics like cast, religion, mothers education and various durable assets available at household during the survey. An asset-based wealth index is computed using principal component analysis (PCA), using standard methodology frequently uses in Demographic Health Surveys (DHS) 20. The wealth index was divided into quintals, poorest at the bottom and richest on the top.
Statistical Analysis
The analysis were performed using Stata version 16.0 (StataCorp, College Station, TX, USA) and sample weights were used appropriately for the analysis. Estimated prevalence of different micronutrient with 95% confidence interval (CI) was presented. The deficiency criteria followed WHO recommendations. Cross tabulation was carried out to understand how MND varies with different background variables.
Results
Sample Characteristics
This analysis of the study was based on 8,242 children aged 1-4 years who had complete biomarker data. Majority of the sampled children (56.5%) were from rural areas. Majority of the children are male (53.5%). The religious cohort is predominantly Hindu (70.5%) followed by Muslim (12.1%) and Christian (10.4%). The caste distribution in the sample is relatively balanced with Schedule Tribes (18.7%), Schedule Castes (18.5%), Other Backward Classes (31.2%) and Other Castes (31.5%). In terms of educational attainment of mothers, reveals a generally educated sample with a negligible proportion of mother who never attended school (0.7%). Majority of the mother have attended secondary education (27.9%) and remarkably 17.6% of mother pursued higher education Table 1.
Table 2 outlines the prevalence of anemia, micronutrient deficiency status and cut-off point for measurement in the sample population. The overall prevalence of anemia for the children was 40.7%. Among the micronutrient deficiencies, folate was the most prevalent (22.9%), closely followed by zinc (18.7%) and vitamin A (18.3%). Vitamin B12 and vitamin D deficiencies were found to be prevalent in 13.8% and 14.0% of children, respectively. Iron deficiency, based on low serum ferritin, was present in 31.6% of the children.
Table 1. Sociodemographic characteristics of the study population (Children aged 1-4 years, CNNS 2016-18).| Characteristic | N | % |
| Place of residence | ||
| Rural | 4,846 | 56.50 |
| Urban | 3,731 | 43.50 |
| Sex | ||
| Male | 4,590 | 53.52 |
| Female | 3,987 | 46.48 |
| Religion | ||
| Hindu | 6,044 | 70.47 |
| Muslim | 1,039 | 12.11 |
| Christian | 895 | 10.43 |
| Others | 599 | 6.98 |
| Caste | ||
| Schedule Caste | 1,588 | 18.51 |
| Schedule Tribe | 1,607 | 18.74 |
| OBC | 2,678 | 31.22 |
| Others | 2,704 | 31.53 |
| Educational attainment of mothers | ||
| Never attended school | 49 | 0.70 |
| Primary Education (1-5) | 1,081 | 15.39 |
| Upper Primary (6-8) | 1,551 | 22.08 |
| Secondary (9-10) | 1,962 | 27.93 |
| Higher Secondary (11-12) | 1,146 | 16.31 |
| Graduation and above (13 and Above) | 1,236 | 17.59 |
| Micronutrient and Anemia | Cut-off | Prevalence (%) | 95% CI Interval |
| Anemia | Hb < 11.0 g/dL | 40.7 | (39.2 - 42.2) |
| Iron Deficiency | Ferritin < 12 μg/L | 31.6 | (30.1 - 33.1) |
| Zinc Deficiency | Serum Zn <65 μg/dl | 18.7 | (17.5 - 19.9) |
| Vitamin A Deficiency | Serum retinol concentration <20 μg/dL | 18.3 | (17.1 - 19.5) |
| Vitamin B12 Deficiency | < 203 pg/mL | 13.8 | (12.8 - 14.8) |
| Vitamin D Deficiency | 25(OH)D < 12 ng/mL | 14.0 | (12.9 - 15.1) |
| Folate Deficiency | < 151 ng/ml | 22.9 | (21.6 - 24.2) |
Burden of Multiple Micronutrient Deficiencies
A significant burden of micronutrient deficiencies was revealed in the analysis of co-existing deficiencies. Only 31.6% of children had no micronutrient deficiencies. More than two third (68.4%) of children had one or more deficiencies and strikingly nearly one-third children (32.8%) aged 1-4 years in India were suffering from two or micronutrient deficiencies (Figure 1). It is evident from the analysis that under-five children in India suffer from multiple micronutrient deficiencies (MMND). This poses a critical public health issue.
Figure 1. Prevalence of multiple micronutrient deficiencies among Indian children aged 1-4 years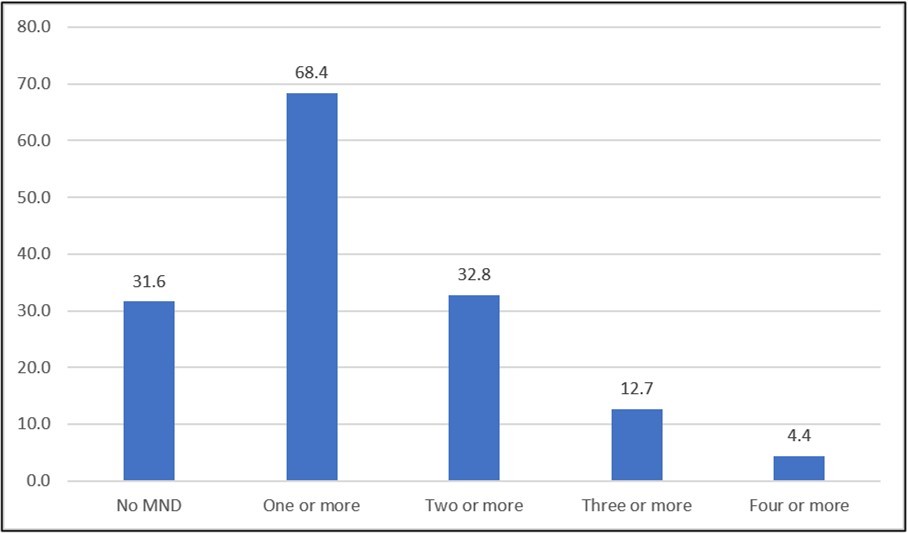
Download figure
Regional Variations
Table 3 presents the state-wise prevalence of multiple micronutrient deficiencies (MMND) among children in India, revealing significant heterogeneity. The data reveals that micronutrient deficiency is a serious problem in our country where 68.4% of children suffer from one or more micronutrient deficiencies. Geographically, this deficit also varies significantly from one state to another.
Table 3. State wise prevalence of micronutrient deficiencies| States | No MND | One or more | 2 and More | 3 and More | 4 and More |
| Gujarat | 6.0 | 94.0 | 57.9 | 28.1 | 15.4 |
| Madhya Pradesh | 10.1 | 89.9 | 58.2 | 30.4 | 10.1 |
| Nagaland | 11.1 | 88.9 | 27.8 | 11.1 | 0.0 |
| Rajasthan | 12.8 | 87.2 | 53.8 | 20.5 | 2.6 |
| Punjab | 14.5 | 85.5 | 53.4 | 25.5 | 11.0 |
| Haryana | 14.8 | 85.2 | 45.1 | 16.0 | 5.6 |
| Uttarakhand | 15.2 | 84.8 | 56.6 | 29.0 | 13.5 |
| Maharashtra | 17.5 | 82.5 | 47.0 | 20.8 | 4.4 |
| Karnataka | 20.2 | 79.8 | 40.1 | 17.4 | 5.0 |
| Chhattisgarh | 20.8 | 79.2 | 41.8 | 17.3 | 4.4 |
| Telangana | 24.3 | 75.7 | 42.0 | 16.5 | 6.3 |
| Tamil Nadu | 24.3 | 75.7 | 31.7 | 10.3 | 2.6 |
| Himachal Pradesh | 25.4 | 74.6 | 32.5 | 14.0 | 4.8 |
| Jharkhand | 26.2 | 73.8 | 43.9 | 22.5 | 8.5 |
| Andhra Pradesh | 26.4 | 73.6 | 28.2 | 6.2 | 1.3 |
| Assam | 26.5 | 73.5 | 27.9 | 7.4 | 0.9 |
| Uttar Pradesh | 26.7 | 73.3 | 34.9 | 14.4 | 8.2 |
| NCT of Delhi | 27.2 | 72.8 | 34.9 | 13.9 | 6.3 |
| Bihar | 30.0 | 70.0 | 37.9 | 12.2 | 3.1 |
| Jammu and Kashmir | 31.3 | 68.7 | 30.9 | 11.1 | 4.9 |
| India | 31.6 | 68.4 | 32.8 | 12.7 | 4.4 |
| Mizoram | 33.5 | 66.5 | 28.3 | 8.4 | 2.1 |
| Manipur | 35.4 | 64.6 | 27.6 | 9.3 | 2.6 |
| Odisha | 39.3 | 60.7 | 28.0 | 7.1 | 1.2 |
| Meghalaya | 41.2 | 58.8 | 24.2 | 7.3 | 1.8 |
| Arunachal Pradesh | 43.6 | 56.4 | 19.7 | 7.6 | 1.3 |
| Sikkim | 45.9 | 54.1 | 17.4 | 4.6 | 1.8 |
| Kerala | 47.1 | 52.9 | 22.7 | 5.8 | 0.9 |
| Tripura | 52.4 | 47.6 | 22.1 | 5.2 | 1.3 |
| Goa | 53.4 | 46.6 | 17.3 | 7.5 | 1.5 |
| West Bengal | 62.9 | 37.1 | 8.3 | 1.5 | 0.3 |
The prevalence of this deficiency is highest in the western Indian states of Gujarat and central Indian states of Madhya Pradesh, where around 90% children are suffering from one or more deficiencies and more than half are suffering from two or more deficiencies. This spread of deficiency further increases the risk to child health. Most of the Eastern and North Eastern states have a micronutrient deficiency prevalence lower than the national level prevalence. Notably, the conditions in West Bengal most favorable, where 62.9 percent of children having no micronutrient deficiency.
Socioeconomic Disparities in Anemia and Micronutrient Status
The analysis reflects a clear and consistent socioeconomic disparities in nutritional and micronutrient deficiencies among India children. Table 4 shows that the prevalence of anemia was more than double in the poorest wealth quintile (59.8%) compared to the richest quintile (23%).
Table 4. Prevalence of anemia and micronutrient deficiencies by wealth quintile among children aged 1-4 years in India (CNNS 2016-18)| Nutrient Status | Poorest (Q1) | Poorer (Q2) | Middle (Q3) | Richer (Q4) | Richest (Q5) | Total |
| Anemia | ||||||
| Non-Anemic (≥11.0 g/dL) | 40.2 | 47.7 | 59.0 | 67.0 | 77.0 | 59.3 |
| Anemic (<11.0 g/dL) | 59.8 | 52.3 | 41.0 | 33.0 | 23.0 | 40.7 |
| Iron Deficiency | ||||||
| Not Deficient | 64.9 | 67.5 | 67.9 | 70.3 | 70.7 | 68.4 |
| Deficient | 35.1 | 32.5 | 32.1 | 29.7 | 29.3 | 31.6 |
| Vitamin A Deficiency | ||||||
| Not Deficient | 62.7 | 67.3 | 86.3 | 92.9 | 93.7 | 81.7 |
| Deficient | 37.3 | 32.7 | 13.7 | 7.1 | 6.3 | 18.3 |
| Vitamin B12 Deficiency | ||||||
| Not Deficient | 78.2 | 82.3 | 85.6 | 89.7 | 93.0 | 86.2 |
| Deficient | 21.8 | 17.7 | 14.4 | 10.3 | 7.0 | 13.8 |
| Vitamin D Deficiency | ||||||
| Not Deficient | 81.4 | 83.5 | 83.4 | 91.6 | 88.8 | 86.0 |
| Deficient | 18.6 | 16.5 | 16.6 | 8.4 | 11.2 | 14.0 |
| Zinc Deficiency | ||||||
| Not Deficient | 72.5 | 73.3 | 76.6 | 89.5 | 91.1 | 81.3 |
| Deficient | 27.5 | 26.7 | 23.4 | 10.5 | 8.9 | 18.7 |
| Folate Deficiency | ||||||
| Not Deficient | 69.9 | 73.5 | 70.0 | 84.8 | 84.5 | 77.1 |
| Deficient | 30.1 | 26.5 | 30.0 | 15.2 | 15.5 | 22.9 |
This pattern is even more evident in the case of various micronutrient deficiencies. For example, it appears that the prevalence of vitamin A deficiency in the poorest children (37.3%) are nearly 6 times higher compared to the richest children (6.3%). Similarly, zinc (27.5% vs. 8.9%) and folate (30.1% vs. 15.5%) deficiencies were 3 and 2 times higher among the poorest compared to richest, respectively. In case of Iron, vitamin B12 and vitamin D deficiencies an inverse relationship with wealth index has been observed, though the differences were comparatively less.
Discussion
This study provides nationally representative data on micronutrient deficiencies among children aged 1-4 years in India. The high prevalence of multiple micronutrient deficiencies (MMND) among children under five years of age in India poses a significant public health challenge for the country. Insufficient dietary diversity, poor sanitation and socio economic disparities may be playing a crucial role such deficiencies. In this study it is clearly evident that socio economic disparities is one of the important factors of micronutrient deficiency. This micronutrition burden severely damages children's development, resulting in impaired intellectual development, growth, weakened immunity and increased mortality. This leads to poor human capital formation and perpetuating intergenerational cycles malnutrition and poverty. This problem cannot be addressed by any single program, this requires coordination of various programs, including food security, diversified complementary foods and WASH programs in our national health and development agenda. There are dearth of national level study which have measured micronutrient deficiencies among young children.
Findings of this study represents lower estimates of three or more micronutrient deficiencies among children compared to a study conducted in Delhi slum where 57 percent of children had at least 3 deficiencies 17. The most common deficiencies—folate, zinc, and vitamin A—indicate that there exists significant gaps in the quality of the diet consumed by young Indian children. Folate which is crucial for cell division and growth, is abundant in green leafy vegetables and legumes. Meat, eggs and whole grains are rich in Zinc, which is essential for immune system and linear growth.
The most important finding of the study is the inverse relationship between household poverty and the micronutrition status of young children. This pattern is more evident in case of vitamin A, Zinc and folate. This demonstrates how nutrient-dense foods like dairy, eggs, fruits and vegetables are more expensive and less accessible for low-income families 21. Additionally, poorer households frequently have less hygienic conditions, which increases the risk of recurrent infections and parasites, which can both cause and worsen micronutrient deficiencies by increasing nutrient losses and impairing absorption 22.
This study has many limitations. There is no data on household food intake patterns or morbidity information of the indexed child. If they were available, it would be possible to study how food intake patterns affect micronutrient deficiency and how morbidity is affected by micronutrient deficiency. Despite such limitations, this study is very important because it provides national and state level statistics of various micronutrient deficiencies among pre school children in India.
Conclusion
This study clearly demonstrates that malnutrition and micronutrition deficiencies among Indian children aged 1-4 is not simply due to anemia or one or two micronutrient deficiencies, rather, there are co-existing multiple micronutrient deficiencies, which is deeply rooted in socio-economic inequality.
The current existing nutrition program of the Government of India, such as the Anaemia Mukt Bharat (Anemia Free India) strategy and distribution of iron-folic acid supplements through Integrated Child Development Services (ICDS), important steps to improve nutritional status, however, it is clear from this study that a paradigm shift in the approach is needed to address multi-micronutrient deficiencies in current nutrition interventions.
To eliminate the inverse relationship between multiple micronutrients and household income, the first step is to ensure the accessibility of balance diet to all households across different economic strata. To do that, the first thing that is needed is to improve the people's economy through various development programs and to make some positive changes in agricultural policy and food fortification.
References
- 1. (2021) International Institute for Population Sciences. National family health survey (NFHS-5) India 2019-21. Demogr Heal Surv.
- 3.Balarajan Y, Ramakrishnan U, Özaltin E, Shankar A H, S V. (2011) Anaemia in low-income and middle-income countries. The Lancet. 378.
- 4.Oppenheimer S J. (2001) Iron-deficiency anemia: reexamining the nature and magnitude of the public health problem. , J Nutr.131
- 5.Fishman S M, Christian P, West J. (2000) The role of vitamins in the prevention and control anaemia. , Public Health Nutr 3(2).
- 6.Black R. (2003) Micronutrient deficiency - An underlying cause of morbidity and mortality. , Bulletin of the World Health Organization 81.
- 7.Bailey R L, West K P, Black R E. (2015) The epidemiology of global micronutrient deficiencies. , Ann Nutr Metab 66.
- 8.Semba R D, Bloem M W. (2002) The anemia of vitamin a deficiency: Epidemiology and pathogenesis. , European Journal of Clinical Nutrition 56.
- 9.Shalini T, Pullakhandam R, Ghosh S, Kulkarni B, Rajkumar H et al. (2023) . Prevalence of Vitamin B12 and Folate Deficiencies in Indian Children and Adolescents. Nutrients 15(13).
- 10.Prasad A S. (2009) Zinc: Role in immunity, oxidative stress and chronic inflammation. Current Opinion in Clinical Nutrition and Metabolic 12.
- 11.Smith E M, Tangpricha V. (2015) Vitamin D and anemia: Insights into an emerging association. Current Opinion in Endocrinology, Diabetes and Obesity 22.
- 12.Atkinson M A, Melamed M L, Kumar J, Roy C N, Miller E R et al. (2014) Vitamin D, race, and risk for anemia in children. , J Pediatr 164(1).
- 15.Ramakrishnan U. (2002) Prevalence of micronutrient malnutrition worldwide. In: Nutrition Reviews.
- 16.Ghosh A, Dey S, Singha R. (2023) Environmental health problems among children in North Eastern States of India. , J Health Manag
- 17.Houghton L A, Trilok-Kumar G, McIntosh D, Haszard J J, Harper M J et al. (2019) Multiple micronutrient status and predictors of anemia in young children aged 12-23 months living in. PLoS One. 14(2) , New Delhi, India
- 18.Poel E Van De, Hosseinpoor A R, Jehu-Appiah C, Vega J, Speybroeck N. (2007) Malnutrition and the disproportional burden on the poor: The case of Ghana. , Int J Equity Health 6.
- 19.Haddad L, Alderman H, Appleton S, Song L, Yohannes Y. (2003) Reducing child malnutrition: How far does income growth take us? World Bank Econ Rev. 17(1).
- 20.Rutstein S, Johnson K. (2004) . The DHS wealth index. DHS comparative reports no. 6. ORC Macro, MEASURE DHS. Calverton, Maryl ORC Macro .