
Abstract
This paper describes the theoretical foundations for the electric power and hydrogen generator that functions with zero energy input without violating the laws of thermodynamics. This generation system is a combined energy cycle consisting of the H2O=H2+1/2O2 reduction reaction performed by the water electrolytic cell and the H2+1/2O2=H2O oxidation reaction performed by the fuel cell. This electrolytic method differs from the conventional electrolytic scheme in that if a quasi-static process is assumed, so that the theoretical power requirement is only 17% of the total energy required. This method performs electrostatic-to-chemical energy conversion by electrostatic-induction potential-superposed electrolytic scheme. If this electrolytic cell that delivers the pure stoichiometric H2-O2 mixture is combined with a fuel cell to form an energy cycle, then this may lead to the concepts of a hydrogen redox electric power generator and a hydrogen redox hydrogen generator that use alkaline water electrolyte or solid polymer electrolyte membrane (PEM) for both electrolytic cell and fuel cell. In the power generator, part of power delivered by the fuel cell is returned to the electrolytic cell, and the remainder represents the net power output. According to calculations based on data from the operational conditions for commercially available electrolytic cell and fuel cell, more than 70% of the power delivered from the fuel cell can be extracted outside the cycle as net power output without the use of any external source of energy.
Author Contributions
Academic Editor: Weihe Zhang, The University of North Carolina at Chapel Hill, USA.
Checked for plagiarism: Yes
Review by: Single-blind
Copyright © 2018 Katsutoshi Ono
 This is an open-access article distributed under the terms of the Creative Commons Attribution License, which permits unrestricted use, distribution, and reproduction in any medium, provided the original author and source are credited.
Competing interests
The authors have declared that no competing interests exist.
Citation:
Introduction
Research on the electric power generation in the absence of external energy is nascent 1. The present paper is an extended version that is useful for making an objective engineering judgement of this type of energy generation system. The on-board self-sustaining power generator presented here has no relation to the perpetual motion machine; it does not violate the laws of thermodynamics. Therefore, a large proportion of the paper deals with the theoretical foundations to support the feasibility of the method.
This generation system has an energy cycle that can be viewed as a two-stage generator that consists of two different energy conversion devices. The pure stoichiometric H2-O2 fuel for fuel cell is generated by the water electrolytic cell with electrostatic-induction potential-superposed electrolytic scheme (ESI-PSE) that enables the H2O→H2+1/2O2 reduction reaction, based on electrical-to-chemical energy conversion. The power generation device is a fuel cell in which the reverse reaction occurs, i.e., the H2+1/2O2→H2O oxidation reaction, based on chemical-to-electrical energy conversion. In the power generation, part of the power generated by the fuel cell is returned to the electrolytic cell and the remainder represents the net power output. In addition to cycling the generated power, H2O, which contains heat from the exothermic reaction in the fuel cell, is transferred to the electrolytic cell to be utilized for the endothermic reduction reaction. In the hydrogen generation, part of the hydrogen delivered from the electrolytic cell is returned to the fuel cell to generate power, and the remainder represents the net hydrogen output. These generation systems are based on a thermodynamic cycle where the electrical energy delivered by the fuel cell is the total power, whereas the electrical energy required by the ESI-PSE electrolyzer is mainly electrostatic energy free of power: theoretically, 83% of the total energy , i.e., the standard enthalpy change required for the reduction of H2O, is the electrostatic energy for which the outside voltage source is not required to provide power, only a static voltage to the electrodes. Here we intend to address:
Description of the Method
The theoretical backgrounds for the ESI-PSE. The system design concept of the combined energy cycle using the existing bipolar water electrolyzer and fuel cell.
Simulation of the hydrogen redox electric power and hydrogen generators using the operational condition data available for the commercial electrolyzer and fuel cell.
Method
Electrostatic-Induction Potential-Superposed Electrolysis(ESI-PSE)
The electronic behavior of a hydrogen electrolytic cell as a circuit element can be represented with a nonlinear V-I characteristic curve as shown schematically in Figure 1. The V-I curve shows that the total cell voltage Ee is the superposition of two separate voltages: (1) the practical decomposition voltage, Ed and (2) the additional applied voltage ΔE, which when superposed on Ed, yields the electrolytic current, Ie, ΔE is then identified with the electromotive force (emf) for conducting electrolytic current. Because the decomposition voltage Ed is a limit to the null-current static condition, it is identified with the barrier potential2, 3, 4, 5. For a cell undergoing electrolysis, the voltage source external to the cell must supply a voltage Ee,,given by:
Ee= Ed +ΔE. (1)
Figure 1.Operation of a water-electrolytic cell with polymer electrolyte membrane (PEM). a, unit cell connected to a single power supply: PS: power supply; Q: charge on the electrode surface; E: electrostatic field vector; A: electrode surface area; L: distance between the electrodes. b, V-I characteristics curve. Ed: decomposition voltage; Ee: electrolytic voltage; ΔE: extra applied voltage over Ed.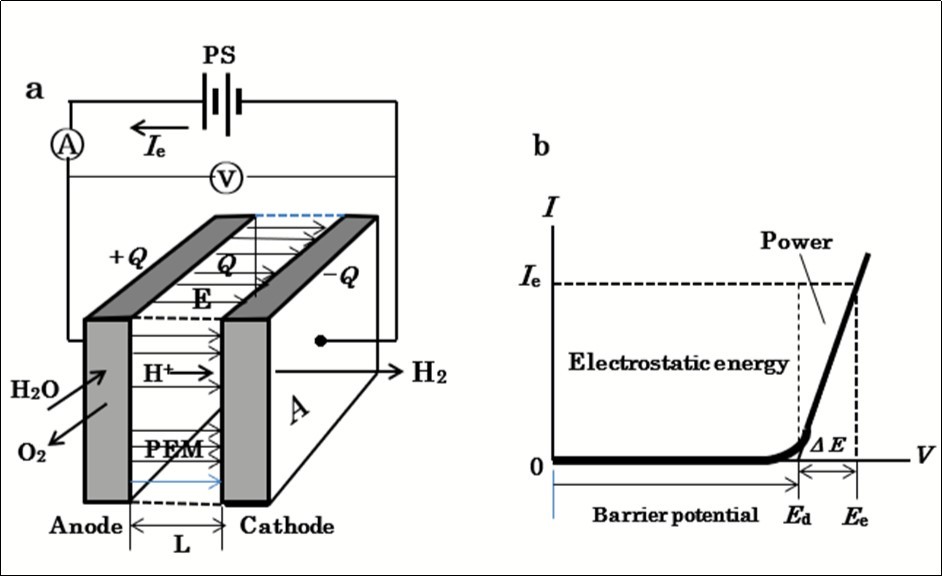
When the current Ie flows, by the application of Ee, the product EeIe represents the total power that the power supply is required to provide. The value of this power is dependent on the value of Ed, as expressed by:
P = Ie (Ed +ΔE). (2)
The first term EdIe represents the power provided by the source to the current to overcome the barrier potential Ed before the cell conducts. The conventional electrolytic scheme with a single voltage source (SSE) requires the power given by Eq.(2).
The method of ESI-PSE shown in Figure 2a, supplies potentials to the electrodes in a dual manner. That is the superposition of voltages using two independent voltage sources; a bias-voltage source, which induces Ed at the cell electrodes (Step 1 in Figure 2b), and a dc power supply, which provides power to the cell (Step 2 in Figure 2b). These sources can act in parallel independently, and supply the cell electrodes with individual potentials, thus yielding a superposition such that the resulting voltage between the cell electrodes equals the magnitude of the algebraic sum of the individual potential, i.e.,Ed+ΔE ( Figure 2c).
The bias-voltage-source does not need to produce electrical current, but merely a static voltage because of the nullcurrent condition at Ed. The cell voltage Eeis the superposition of ΔE on Ed, and the entire corresponding electrolytic process is the superposition of the charge-transfer process where ΔE is applied (i.e., power is used) on the process of electrostatic energy creation where Ed is applied (i.e., power is not used). If the current 2F flows to produce 1 mole of H2 and one-half mole of O2, and because the current efficiency is known from experimental evidence to be nearly unity, the total power requirement for the ESI-PSE reduces to the generalized form for any given cell, regardless of Ed, temperature, pressure, composition of electrolyte solution and cell dimension:
P* = 2F(Ee-Ed)=2FΔE. (3)
Figure 2.Principle of the ESI-PSE. a, behavior of the ESI-PSE system when undergoing electrolysis. FG: field generator; A: anode; C: cathode; Rcell: cell resistance. b, equivalent circuit for step 1. c, equivalent circuit for step 2.
The bias voltage source PS1 is responsible for creating the electrostatic energy to place H2O in the decomposition state. It is employed to induce potential Ed between the electrodes by means of the electrostatic induction, thereby making the electrodes bipolar. The system therefore consists of two circuits, Loop 1 and Loop 2. The total bias voltage is equally divided into Ed among the three channels, FG(+)-A, B-C and C-FG(-). Hence, Ed is induced as a floating potential on the cell electrodes with polarity as shown in Figure 2a. This system is able to prevent the two voltage sources from affecting each other. Because of the null-current condition, PS1 does not need to provide current, but merely induce a static voltage on the electrodes. The cell can now be replaced by an isolated circuit that contains an induced voltage source delivering an output voltage of Ed between the cell electrodes, A and C. The performance of the cell can be explained through a series of steps. First, when PS1 output voltage VPS = Ed, I = 0 (null point). Second, if VPS is increased from the null point, an electrolytic current I = Ie flows owing to the total source voltage (emf) of ΔE =VPS ‒ Ed. Hence, the two sources can be replaced by a single source that delivers ΔE. Furthermore, the voltage across the cell (cell voltage) is Ed + ΔE, as a result of the superposition of ΔE on Ed. If the current 2F flows to produce 1 mole of H2 and one-half mole of O2, and because the current efficiency is known from experimental evidence to be nearly unity, the total power requirement for ESI-PSE reduces to the generalized form given by Eq. (3) for any given cell, regardless of the decomposition voltage Ed, temperature, pressure, composition of electrolyte solution and cell dimension: In a typical cell system in which the cell is connected to a single voltage source (SSE), the power required to generate 1 mole H2 is given by,
Po = 2F(Ed +ΔE). (4)
To compare the power between two electrolytic schemes, we have the power ratio:
P*/Po =ΔE /(Ee+Ed). (5)
Experimental Verification
Experimental Method
A direct measurement of power requires simultaneous direct measurements of voltage and current. However, in the above experimental setup, the electromotive force,ΔE, is determined as the change in voltage from the original value of Ed. To definitively verify the ESI-PSE scheme, it is necessary to test with a different scheme in which both the emf provided by the power supply and the current can be read directly on a voltmeter and an ammeter, respectively, enabling us to measure the power directly. This may be achieved by the double cell unit and external circuit shown in Figure 3a. This circuit consists of three pairs of electrodes and two equivalent cells, labeled Cell 1 and cell 2, which have the same physical size as the single cell. The outermost A-F pair represents the field generator electrodes connected to a bias voltage source, labeled PS1, which induces a bias potential at the inner electrodes by a mechanism similar to that in the previous case. The B-E middle pair is connected to another bias voltage source , labeled PS2, to impose a voltage opposing the voltage induced between B and E. Note that electrode B should be connected to thepositive output terminal of PS2 and electrode E to the negative output terminal. Hence, electrode B acts as the anode for Cell 1 and electrode E as the cathode for cell 2. The innermost C-D pair forms an open channel, and is connected to the third power supply, PS3, which provides the emf for electrolytic currents. Electrodes C and D acts as the cathode for cells 1 and 2, respectively. The polarity of the PS3 output terminal must be such that electrode C and D are connected to the negative and positive output terminals, respectively. Then, the loop, PS2(+)-B-C-PS3-D-E-PS2(—) forms the main electrolytic circuit. The performance of the cell can be explained through a series of steps. Step 1: When a voltage 2Ed is first induced between B and E by regulating the output voltage of PS1, while the voltage between C and D remains zero. A bias voltage, Ed, appears on both cells 1 and 2 (B-C and D-E), such that electrode B becomes positive with respect to electrode E. However, the innermost electrodes, C and D, are held at the same potential because electrons can move from D to C, passing through the supply PS3 (Figure 3b). Step 2: A counter bias voltage of 2Ed is then applied by the second bias voltage source, PS2, while the voltage between C and D remains zero, such that the counter voltage opposes the induced bias cell voltage between B and E. At this stage, both cells 1 and 2 are at Ed, while the voltage between C and D remains zero. Step 3: When the output voltage of PS3 rises from zero, the current begins to flow, as indicated by the arrows in Figure 3a. In this case, the voltages measured directly with a voltmeter between electrodes C and D are identified as the emf’ ‘s that conduct electrolytic current. The measured voltage gives the total source voltage (or emf) equal to the additional applied voltage, 2ΔE, in the electrolytic circuit as a result of potential superposition (Figure 3b). Thus, the product of the measured voltage and corresponding current yields the actual power provided by the source to the load. Step 4: To test the SSE mode in situ, this unit was converted into the SSE scheme by disconnecting PS1, PS2, and PS3, connecting the power supplies to Cells 1 and 2, respectively, and the V-I characteristics curve was measured for each cell.
Figure 3.ESI-PSE double cell unit. a, system configuration. SE: solid electrolyte; PS: power supply; A1, A2, A3. ammeters. b, operation procedure. Rcell: cell resistance; Ie: electrolytic current.
The present cell shown in Figure 3a, was made of acrylic resin, contained six 62x40 mm electrodes, all 0.5 mm thick, made of rectangular stainless steel sheets. These were set in parallel and fixed to the side wall and the bottom of the tank. The electrodes formed two walls of a square channel, with insulators forming the other two walls. The distance between the cell electrodes was 20 mm. A diaphragm was not used to prevent a back reaction between hydrogen and oxygen because the present study was not concerned with current efficiency. The maximum voltage was applied to the field-generator electrodes so that if there were any opening in the inner cell electrode plates, an unexpected leakage of current would occur. An alkaline water electrolyte, H2O-10%NaOH, at 300 K was selected for all tests.
Experimental Results
The experimental results are shown inFigure 4. The values observed for the ESI-PSE appear somewhat dispersed. This may be because three voltage supply circuits are electrically floating. Figure 4b, is the V-I curves measured for both SSE and ESI-PSE modes. The current densities measured at A2 were plotted against circuit emf ; Ed was then determined to be 1.7 V by extrapolating the straight line to the voltage axis. In Figure 4a, the voltages between electrodes A-F, B-E and B-C were plotted as function of the cell voltage (emf ) measured between the electrodes C and D. The voltages EA-F and EB-E must remain constant as EC-D changes, i.e., EA-F=1.7x4=6.8 V and EB-E=1.7x2=3.4 V, respectively. However, the measured values for EB-E were higher than the theoretical line. EB-C is theoretically related to EC-D (negative value) by the equation, EB-C=Ed—1/2EC-D=1.7—1/2 EC-D. Therefore, if EC-D=0, EB-C=Ed=1.7 V, and if EC-D=—2.0 V, EB-C=2.7 V.
Figure 5, shows the experimental power requirements for both ESI-PSE and SSE modes. The mutual consistency expressed by Eq.(5) with respect to the power requirements for both SSE and ESI-PSE mode can thus be established.
Figure 4.Experimental results. a, inter-electrode voltage as function of EC-D. b, V-I curves for water-electrolysis with SSE and ESI-PSE modes.
Figure 5.Power requirements as function of the cell voltage for both SSE and ESI-PSE modes.
ESI-PSE Cell Module
A typical bipolar electolyzer currently used in industry can be applied to the ESI-PSE electrolyzer. The outermost pair of electrodes is used as a field generator and should be connected to the power supply PS1, as shown inFigure 6. The power supply responsible for providing power should be connected to the electrodes next to the field generator electrodes. There is no need for lead wires to take current from each of the inner cells. The electrode potential of any individual cell in the stack is driven by electrostatic induction. PS1 is employed to induce a potential, Ed, in (n-1) series cells where n is the number of cell electrodes, and the total potential between the first and nth electrodes is (n-1)Ed . When a voltage of (n-1)(Ed+∆E) is applied between these electrodes using PS2, with a polarity opposite to that induced by PS1 (i.e., (n-1)Ed), an emf∆E appears at each cell owing to potential superposition. Thus, current, Ie, flows through the electrolytic circuit owing to the total emf, which is equal to (n-1) ∆E. Therefore, the total power requirement is given by
P * = Ie (n-1) ∆E, (6)
for the ESI-PSE, and
P =Ie (n-1)(Ed +∆E), (7)
for the conventional SSE.
Figure 6.Schematic diagram of the PEM electrolytic cells connected in series with ESI-PSE mode. n: number of cell electrodes.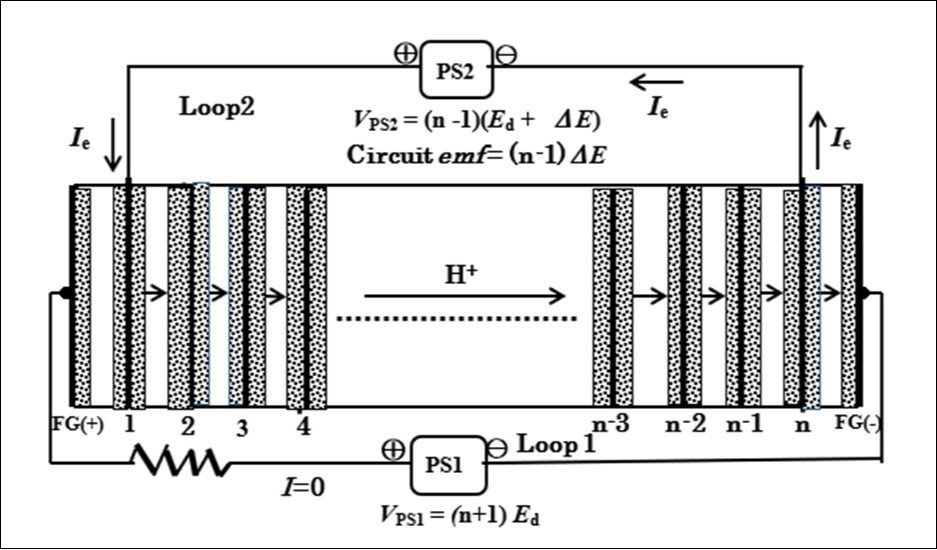
The V-I curve for the alkaline water electrolyzer is characterized by the transitional region below the theoretical decomposition voltage due to the solubility of generated hydrogen into the aqueous electrolyte as shown in Figure 7. This causes undesirable current to flow in the bias voltage circuit (Loop 1 in Figure 2a), and thus some power is lost. When the power supply PS1 imposes the cell voltage at Ed, the current at point a in Figure 7, flows through Loop 1, which causes extra power consumption. According to theoretical calculations this power accounts for 40% of the power required when the electrolyzer runs at an extra applied voltage ΔE = 0.2 V and a current density of J=1000 A/m2 (current in Loop 2). To lower the current level down to point b, and thus minimize the extra power consumption, a resistor R, is required between PS1 and the cell module (Figure 7).
Figure 7.V-I characteristics in the transitional region around the decomposition voltage.
Let n be the number of cells in the ESI-PSE electrolyzer and each cell is imposed equally at Ed. If the resistor is not present and a current Io flows in Loop 1, then the power provided by PS1 is Po = nEd Io. Next if a resistor with resistance R is present and a current I flows, then the power supplied by PS1 is P = RI2 + nEdI. Hence, the following relationship must be satisfied:
RI2 + nEdI — (P/Po)( nEd)Io = 0. (8)
Eq.(8) is applied to evaluate the current reduction ratio, I/Io to the case of a ESI-PSE electrolyzer with the following conditions:
Power reduction ratio, (P/Po) = (1/10),
Loop 1 current per 1 m2 electrode surface area, Io = 40 Am-2,
Number of cells, n = 8, and
Decomposition voltage, Ed = 1.7 V.
The results obtained were I/Io = 0.080, 0.067, 0.060 and 0.051 for R = 1.0, 2.0, 3.0 and 5.0 Ω, respectively. It may thus be possible that the resistor serves to significantly reduce the magnitude of the V-I transitional current.
Fundamental Theories
“Zero Power Input” Electrostatic Energy
This paper suggests that the electric power and hydrogen energy can be produced in the absence of external energy. However, it must be noted that this generation system does not have any relation to a perpetual motion machine. The origin of the net electric power extracted from the generation cycle is “zero power input” electrostatic energy which is created and stored in the electrolytic cell due to an intrinsic coulombic force at the decomposition voltage during electrolysis. It is then essential to prove the existence of this kind of energy.
Figure 8 is the schematics representing the performance of electrochemical cells in which there are always ionic flows by migration. In these cells, the electrons flowing in the external circuits are prohibited to enter the electrolyte, so that the energy source for migration of ions in the electrolyte is the electrostatic field strength established by time-invariable potential difference between the electrodes.
Figure 8.Electrochemical cells in operation. a, water electrolysis. A: anode; C: cathode; Ielectron:electronic current; Iion: ionic current. b, lithium-ion battery charge. P: positive electrode; N: negative electrode. c, fuel cell. d, ESI-PSE water electrolysis.
As shown in Figure 1a, electrically isolated electrodes bring the surface charge, Q.
The thermodynamic equilibrium conditions for the electrostatic field system shown in Figure 1a, are determined by the Gibbs phase rule6. It fixes the number of intensive variables to establish the equilibrium. If the electrostatic field strength E is included in the independent variables, the number of degrees of freedom is given by f=c+3‒p, where c and p, are respectively the number of components and phases. If f is considered for the H2O-KOH solution (alkaline-water electrolyte used in the water electrolytic cell), c = 3 and p = 1, then f = 5. It follows that if T, P, NH and NK (N: mole fraction) are kept constant, the internal energy U becomes a function of E alone; fixing E within the stability range of the solution fixes its equilibrium state.
The electrochemical system involving electrodes separated by an ionic solution electrolyte stores energy without consuming power, but only if the potential between electrodes is maintained constant. In addition, the ionic current in the electrolyte solution is driven by the electrostatic field free of power and expressed as a function of the electrostatic field strength, (∂φ/∂x)7, 8. The ionic current flows under the influence of an electric field created by the potential difference between the electrodes. The current I due to the migration of charged species j in the bulk region of a linear mass-transfer system having a cross-sectional area A can generally be expressed as:
Ij= |zj|FAujCj(∂φ/∂x), (9)
where zj is the charge number for species j, F is the Faraday constant, uj is the mobility of species j, Cj is the concentration of j, and (∂φ/∂x) represents the electric field strength. Non-electrical term associated with the diffusion was omitted, because the concentration gradient is very small in the bulk solution 8. The fact that the energy storage and the ionic current in the electrolyte does not require power, but only constant electrode potential leads to the principle of the internal self-sustainability for the electrostatic energy.
The main point of the ESI-PSE is the “zero power input” electrostatic energy. This type of energy is observed in the FC (Figure 8c). The FC is able to function exclusively under the zero power input electrostatic energy. When the H2-O2 fuel is applied to the respective electrodes, a constant FC voltage appears between the electrodes, which creates a current flowing through a load located outside the cell. This current generates power in this load using the total energy of the fuel. The energy of the fuel is thus completely converted into power in the load outside the cell. There is then no power inside the cell. This indicates that the spontaneous transfer of ions inside the cell is a power-free phenomenon. No power is required for this kinetic process. This is evidences for the existence of “zero power input” electrostatic energy. For this reason, the electrostatic energy is identified as internally created energy. For the process shown in Figure 2c, the power supply located outside the cell does not need to provide power, but only a static voltage to the electrodes. Therefore, the electrostatic energy is free of power.
Thermodynamic Foundation
The quantity of the energy created in the medium between the electrodes by a constant electrostatic field formed at an inter-electrode voltage, v , equals the energy stored in the medium by the process of charging a capacitor at the same voltage, because both cases are performed at the same constant electrostatic field strength vector, E, thus the same equilibrium state is attained as indicated by the phase rule. The energy, W, stored in the system connected to a voltage source is expressed by:
W = ʃQdv = (1/2)vQ, (10)
using the relation Q=Cv where Q is the charge built up on the electrodes, and C is the capacitance. If we add the relations, v=EL, Q=DA and LA=V, and make use of D=εE, where D is the electric displacement vector and ε is the permittivity, then the Eq.(9) becomes:
W = VεE2/2. (11)
The energetically self-sustaining power generation system is based on this electrodynamic energy which is spontaneously created in an electrolytic cell.
To identify the energy, W, obtained in this manner as a part of the equilibrium internal energy of the system in the electrostatic field, its thermodynamic expression must include the term, VεE2/2. The internal energy of an ionic solution, U, is a function of the thermodynamic factors of the system and is expressed as
U=U ( S, V, nj, D ), (12)
where S is the entropy; V is the volume; nj, the number of moles of the ionic species j. An infinitesimal change in U from this state is
dU=TdS–PdV+Σμjdnj+(VE/2)dD, (13)
where μj is the chemical potential of the ionic species j. The last term on the right was deduced from the relation 9, 10, 11, 12:
(∂U/∂D)S,V,nj=VE /2. (14)
It represents variations in U resulting from variations in the electrostatic field. Because T, P, μj, and E are constant, one may write Eq. (13) in the integrated form:
U=TS‒PV+Σμjnj+VεE2/2. (15)
The integrated quantity of U includes the last term, VεE2/2, then, in the presence of the electrostatic field, the energy increase is thermodynamically favorable; so the energy creation is a consequence of the tendency of the system to approach an equilibrium state.
Electric Power and Hydrogen Energy Generation Systems
System Concept
Energetically self-sustaining energy cycles to produce electric power and hydrogen have been investigated on the basis of ESI-PSE. The system concepts are shown in Figure 9. The electric power generation system is a combined energy cycle consisting of the H2O=H2+1/2O2 reduction reaction performed by the ESI-PSE and the H2+1/2O2=H2O oxidation reaction performed by the fuel cell. Part of the power delivered by the fuel cell is returned to the electrolytic cell and the remainder represents the net power output. In the hydrogen generation system, part of the hydrogen delivered from the EC is returned to the FC to generate power, and the remainder represents the net hydrogen output.
Figure 9.Schematic diagrams showing the generation systems. a, electric power generator. b, hydrogen energy generator.
Major components of the generation system are a fuel cell stack (FC stack), an ESI-PSE cell stack (EC stack). The FC stack converts the pure stoichiometric H2-O2 fuel provided by the EC stack into electricity. In addition to cycling the generated power, H2O, which contains heat from the exothermic reaction in the FC stack, is transferred to the EC stack to be used in its endothermic reaction. The solid polymer membrane electrolyte (PEM) are used for both fuel cell and ESI-PSE water electrolytic cell for the reason of its solid structure and its ability to operate at high current densities. The cell electrodes normally consist of a current collector, gas diffusion electrode and catalyzer electrode. Because these components are electrically conductive, the field generators can induce potentials on the inner electrodes. The EC cells are assumed to use in the bipolar configuration shown in Figure 6. The approach to optimizing the generation system and designing the system to be compact is of preferential importance. The PEM generation system is essentially an energy cycle with close conjunction of two electrochemical devices. It is important to note that with respect to the structure, the PEM EC cell must be identical with the typical PEM FC cell which has established feasibility so far. Both the FC and EC stacks must be constructed in the same form of a bipolar series connection. Only the number of cells connected in series may be different from each other.
Theoretical Assessment of Energy Efficiency
This power generation cycle functions with zero energy input, so that the ordinary definition of energy efficiency is not applicable to the present case. Therefore, the power cycle efficiency was defined as the ratio ξp of the net power extracted from the generator, Pnet, to the power produced by the pure stoichiometric H2-O2 fuel in the FC, Pf:
ξp = Pnet/ Pf. (16)
If the voltage efficiency of FC, η, is the ratio of practical output voltage to the standard output voltage, then for 1 mole H2,
Pf = 2FηEfo. (17)
where Efo is the standard output voltage of FC. Mass balance in the cycle requires equality of the electrolytic and galvanic currents. If the current efficiency is assumed to be unity, then Eq.(3) is subtracted from Eq.(17) to yield the theoretical net power output of the cycle,Pnet . Hence, the cycle power efficiency is rearranged in the form:
ξp = Pnet/ Pf = 1—ΔE / ηEfo. (18)
The hydrogen cycle efficiency,ξH, is defined as the ratio of the net hydrogen output rate from the hydrogen generator, Mnet, to the total hydrogen generation rate from the ESI-PSE EC, MT.If welet Mr be the recycling rate of hydrogen from the ESI-PSE EC to the FC to produce power, then
ξH=Mnet /(Mr+Mnet)=(MT—Mr)/MT (19)
The FC provides power, 2FηEfo, per 1 mole of H2. It can then provide power, 2FMrηEfo, per Mr moles of H2. This power is recycled to the EC stack to generate hydrogen. In the ESI-PSE EC stack, the power given by Eq.(3) is used to generate 1 mole of H2, so that when the power, 2MrηEfo, is applied, the number of H2 moles produced can be described as,
Mr+Mnet= 2FMrηEfo/2FΔE=MrηEfo/ΔE. (20)
Hence, Mnet is given by,
Mnet=Mr(ηEfo/ΔE—1) (21)
Therefore, the hydrogen cycle efficiency is expressed in the same form as Eq.(18):
ξH=Mnet /(Mr+Mnet) =(1—ΔE/ηEfo) (22)
In Figure 10, the cycle efficiencies were plotted as function of ΔE for the ESI-PSE EC and η for the FC. Typical ΔE and η values for the commercial PEM EC and PEM FC are reported to be 0.21 V and 0.8, respectively13; corresponding power and hydrogen cycle efficiencies are near to 80%.
Figure 10.Power and hydrogen cycle efficiencies as function of ΔE and η.
Conclusion
The production of electric power and hydrogen by the hydrogen redox energy cycles in the absence of external energy. An ESI-PSE system was developed to achieve a highly positive power and hydrogen balance of the generation systems, in which the cell undergoing electrolysis can function such that the internally created energy is responsible for the free energy of the net output of power and hydrogen from the generation systems. The origin of internally created energy is the electrostatic field between electrodes. This field exerts intrinsic coulombic force on the hydrogen ions during electrolysis. Experimental results showed that the power requirement of an ESI-PSE system can be expressed as the product of electrolytic current and extra applied voltage over the decomposition voltage, by which the relationship between the power and hydrogen cycle efficiencies and the parameters inherent to the ECs and FCs ere deduced. Numerical evaluation using commercially available data showed the power and hydrogen cycle efficiencies higher than 70 % may be possible.
References
- 1.Ono K. (2015) The Institute of Electrical Engineers of. , Japan, Trans. on Fundamentals and Materials 135, 456-466.
- 7.A J Bard, Faulkner.. A.J.,(2001) ELECTROCHEMICAL METHODS Fundamentals and Applications, 2nded.JOHN WILEY &INC., 139-140.