Abstract
Introduction:
Analysis of 8-oxodG is usually conducted by either chromatography-based methods or by immunochemical methods commonly used based upon their low cost and high-throughput. However, concern regarding the accuracy of ELISA methods has complicated their use. We directly compare the levels of urinary 8-oxodG obtained by HPLC-MS/MS with three commercially available ELISA kits in this report.
Methods:
In the current study, a total of 9 human urine samples were analyzed by LC-MS/MS and three commonly used commercial available ELISA kits.
Results:
We found that urinary 8-oxodG levels analyzed by HPLC-MS/MS [1.4 ± 0.3 nmol/mmol creatinine) were 7.6- to 23.5-fold lower than those detected by ELISA. Overall, the correlations between ELISA and HPLC-MS/MS were poor but were improved after SPE purification for kits from ENZO (P = 0.2817 without SPE; P = 0.0086 with SPE) and Abcam (P = 0.0596 without SPE; P = 0.0473 with SPE).
Discussion and Conclusion:
While we confirmed that SPE purification can improve the correlation between the selected ELISA kits and HPLC-MS/MS, HPLC-MS/MS is still the method of choice to accurately assess the levels of 8-oxodG in human urine.
Author Contributions
Academic Editor: Zhe-Sheng Chenz, Professor, Department of Pharmaceutical Sciences, College of Pharmacy and Allied Health Professions, St. John’s University, United States.
Checked for plagiarism: Yes
Review by: Single-blind
Copyright © 2018 Kun-Ming Chen, et al.
 This is an open-access article distributed under the terms of the Creative Commons Attribution License, which permits unrestricted use, distribution, and reproduction in any medium, provided the original author and source are credited.
Competing interests
The authors have declared that no competing interests exist.
Citation:
Introduction
8-Oxo-7,8-dihydro-2'-deoxyguanosine(8-oxodG), a mutagenic DNA lesion, is one of the most abundant products of DNA oxidation because guanosine is the most readily oxidized DNA nucleosides 1, 2. It is formed through oxidation at the C8 position of the nucleobase guanine in the DNA by the exposure to hydroxyl radical (·OH), superoxide radical (O2-·), hydrogen peroxide or singlet oxygen (1O2). Urinary levels of 8-oxodG represent the product of DNA excision repair of oxidative damage, which is a process involves multiple enzymes with complex regulatory mechanisms. Among them, base excision repair (BER) is the major repair mechanism for this lesion 3, 4. Therefore, urinary levels of 8-oxodG in human and rodents are considered to be a non-invasive biomarker for the determination of reactive oxygen species (ROS) exposure/damage. The analysis of oxidative DNA damage using 8-oxodG as a biomarker is usually conducted by two major categories of methods: chromatography-based analysis and immunochemical methods. Popular chromatographic methods used to analyze 8-oxodG including high performance liquid chromatography (HPLC) with electrochemical detection (EC), gas chromatography with mass spectrometry (GC-MS), and HPLC tandem mass spectrometry (HPLC-MS/MS) 5, 6, 7, 8, 9, 10, 11, 12, 13. Among them, HPLC-MS/MS as well as HPLC-MS3 are considered the gold standard method of 8-oxodG analysis, despite of the high cost of the instrument, its maintenance and operation 14, 15, 16. The European Standards Committee on Oxidative Damage reported that the LC-MS/MS method is the best HPLC procedure and provides structural information on the identity of 8-oxodG 17. The enzyme-linked immunosorbent assay (ELISA) is an indirect approach for 8-oxodG analysis. The analysis of 8-oxodG by ELISA were criticized for its inter-laboratory variability and poor agreement with chromatographic techniques 18; however, its advantages include the capacity for high-throughput and relatively low in cost 15, that can account for its continued common usage.
Several comparisons of urinary levels of 8-oxodG accessed by LC-MS and ELISA methods have been conducted; however, mixed information has been reported. The European Standards Committee for Urinary (DNA) Lesion Analysis (ESCULA) had reported that ELISA demonstrated more within-technique variation than chromatographic methods and showed higher measurements 19. Rossner et al reported that purification of urine by solid phase extraction (SPE) significantly improved the agreement between ELISA and HPLC-MS/MS methods in the determination of urinary 8-oxodG 15; however, the accuracy and specificity of ELISA approaches in urine and saliva even after SPE purification was questioned by other investigators 20, 21. Consequently, it has been stated that current ELISA approaches are not suitable to replace the chromatographic methods for 8-oxodG 18. In the reported HPLC-MS/MS methods, the internal standard was added prior to SPE purification to give accurate estimation of the urinary level of 8-oxodG by HPLC-MS/MS 15, 18. However, this approach may not provide results that are directly comparable to ELISA where 8-oxodG is determined only after SPE. Thus, our present goal was to perform unbiased comparison of the levels of urinary 8-oxodG obtained from both HPLC-MS/MS method with multiple ELISA kits when internal standard was added after SPE purification. To this end and in contrast to previous reports that employed only a single ELISA kit 15{Cooke, 2006 #10}, we have used three commonly used commercial available ELISA kits.
Experimental
The study was approved by the Institutional Review Board of the Penn State College of Medicine (IRB # 22701) in accordance with the Helsinki Declaration of 1975 as revised in 1983. All clinical activities were conducted at the Penn State Hershey Cancer Institute, Hershey, PA. Healthy male and female non-smokers, 30–79 years of age, were enrolled by the study coordinator from the local Hershey/Harrisburg area. Urine samples were obtained and stored at -80°C until analysis. In the current study, a total of 9 urine samples from the above subjects were used.
Instrumentation and Reagents
[15N5]dG was obtained from Cambridge Isotope Laboratories, Inc. Env+Isolute cartridges used for solid phase extraction was purchased from Biotage (Uppsala, Sweden). Three microplate ELISA kits from commercial sources were used (Cayman Chemical, MI [item no. 589320]; ENZO Life Sciences, NY [cat. no. ADI-EKS-350]; Abcam, MA, (cat. no. ab201734]). UV spectroscopy (Beckman Coulter DU 640 spectrophotometer) was used. ELISA quantification was conducted using a Bio-Tek Synergy HT microplate reader. An API 3200™ LC-MS/MS triple quadrupole mass spectrometer (Applied Biosystem) interfaced with an Agilent 1200 series HPLC was used to conduct the MS/MS analysis of 8-oxodG.
Methods
Purification of Urinary 8-oxodG by Solid-Phase Extraction
Urine samples were thawed and then spun at 16,000g for 10 min. The urine samples (0.5 ml) were subjected to solid phase extraction (SPE) using Env+ Isolute cartridges. Samples were diluted 1:1 with deionized water, and the columns were preconditioned with 1 ml methanol followed by 1 ml H2O. Diluted urine samples were loaded onto the columns and washed twice with 300 μl H2O. The fraction contains 8-oxodG was eluted in 2 × 300 μl of 20% (v/v) acetonitrile in methanol, and concentrated under mild N2 stream to dryness.
Elisa
The residue obtained from SPE purification was dissolved in EIA buffer to a level equivalent to 1:150 or up to 1:600 dilution of urine to achieve better accuracy in the competitive ELISA method. Microplate ELISA kits were used according to their manufacturer’s instructions. Analyses were performed in duplicates. Quantification of oxidative markers was measured with a microplate reader.
Preparation of [15N5]8-OxodG
The levels of urinary 8-oxodG were evaluated using the stable isotope dilution LC-MS/MS method, and [15N5]8-oxodG as an internal standard. The preparation of [15N5]8-oxodG was modified from a previously published method [22]. In brief, [15N5]dG (2.5 mg) was dissolved in 2.5 mL of distilled water under ice bath. Afterwards, 175 μL of 170 mM ascorbic acid (freshly prepared), 175 μL of 20 mM copper(II) sulfate were added into the stirred solution. To the above mixture, 125 μL of 30% H2O2 was added drop wise. The reaction mixture was kept under ice bath for 2 hr. The resulted [15N5]8-oxodG was purified by a ODS-AQ reversed-phase 5 µm 6.0 mm × 250 mm (120 Å) column (YMC, Wilmington, NC), using a CH3CN/H2O gradient on a Agilent series 1100 HPLC system (Palo Alto, CA). The column was eluted using a gradient at a flow rate of 1 mL/min with solvent A (H2O) and solvent B (CH3CN). The gradient used was 5% B isocratic for 5 min followed by a linear gradient to 8% over 15 min, followed by another isocratic elution with 8% for 5 min, and another linear gradient to 20% over 5 min, followed by another gradient to 100% over 10 min. The HPLC elution was monitored by UV absorbance at 254 nm. The fractions corresponding to [15N5]8-oxodG were collected, pooled and further purified with another round of HPLC purification using the same program described above. The collected sample was dried by Speed-Vac or under a mild stream of N2. The amount of the 8-oxodG was calculated using the extinction coefficient for 8-oxodG (ε = 10300 M-1 cm-1 at 293 nm) by UV spectroscopy (Beckman Coulter DU 640 spectrophotometer) 22.
HPLC-MS/MS Analysis of 8-oxodG
After SPE purification, urine samples were re-dissolved in H2O to a level equivalent to 1:5 dilution of urine. Then, 4 µL of the solution was mixed with 2 pmole of [15N5]8-oxodG into the solution before LC-MS/MS analysis. The HPLC-MS/MS analysis was conducted using a API 3200™ LC-MS/MS triple quadruple mass spectrometer using an Agilent extend-c18, 5 um, 4.6 × 150 mm column. We used the positive mode to perform the electrospray ionization (ESI). Certain MS parameters were optimized and set to use as follows: electrospray source temperature and voltage were 400°C and 5 kV, respectively; the declustering potential (DP), collision energy (CE), entrance potential (EP), and cell exit potential (CXP) were 18, 19, 10 and 3 ev, respectively; the collision activated dissociation (CAD) gas was set at 5 psi, while the curtain gas was set at 20 psi. The flow rate was 200 ul/min, and the elution solvent system was solvent A (methanol containing 0.1% formic acid) and solvent B (water containing 0.1% formic acid). The following gradient was used: initially, it was isocratic elution with 10% A for 5 min, followed by a gradient to 70% A in 5 min, followed by 70% A in 10 min, continued to 90% A in 30 min, and 90% A was held for another 5 min. The 8-oxodG was monitored in multiple reaction monitoring (MRM) mode. The MS/MS transitions of m/z 284→ m/z 168, and m/z 289→ m/z 173 were for 8-oxodG and [15N5]8-oxodG, respectively. To determine the recovery of 8-oxodG for solid phase extraction, 2 pmole of 8-oxodG was added into 0.25 µL D-H2O, then 4 pmole of of [15N5]8-oxodG was added into each sample before or after solid phase extraction in triplicate. The level of recovered 8-oxodG was subsequently analyzed by LC-MS/MS.
Calibration Curves for 8-oxodG by LC-MS/MS
A Calibration curve was constructed by mixing unlabelled 8-oxodG (0, 0.05, 0.1, 0.25, 0.5 or 1 pmole), 2 pmole of [15N5]8-oxodG and SPE purified urine obtained from healthy donors. The mixture was analyzed by the HPLC-MS/MS using the MRM method described above. Subsequently, the calibration curve was validated by spiking known amount of 8-oxodG into the SPE purified urine and determined by our HPLC-MS/MS system.
Creatinine Assay
Urinary creatinine was determined by reacting with picrate as described previously so as to normalize the urinary levels of 8-oxodG 23.
Statistical Analysis
Summary statistics such as mean and standard deviation were reported for each 8-oxodG measurement. The comparisons between pairs of measurements were conducted using paired-sample T-test. For the same pairs, their associations were examined by using Spearmen correlations. Scatter-plots were generated to graphically show their associations. All analyses were done using statistical software SAS version 9.4 (SAS Institute, Cary, NC, USA). Significance level being used was 0.05.
Results
Preparation of [15N5]8-OxodG
The stable isotope labeled [15N5]8-oxodG was synthesized according to a procedure previously published by Singh et al with modification [22]. The [15N5]dG was oxidized to [15N5]8-oxodG under a very mild condition, and the reaction was allowed to proceed to almost completion as seen in Figure 1; our procedure clearly makes purification simpler. As compared to the previous report, the overall yield of [15N5]8-oxodG was improved after multiple HPLC purification and 422 nmol [15N5]8-oxodG was obtained derived from 9.2 µmol of [15N5]dG.
Figure 1.A representative HPLC chromatogram for the separation of the reaction mixture containing 8-oxodG and dG.
Calibration Curves for 8-oxodG by LC-MS/MS
A calibration curve was constructed for 8-oxodG by LC-MS/MS in the presence of a matrix equivalent to 20 µL of urine. In Figure 2, the calibration curve appears to be linear (r2= 0.9997). Under our experimental condition, the detection limit for 8-oxodG was 30 fmol, and the recovery of 8-oxodG for the SPE method was determined to be 98%.
Figure 2.Calibration curve for 8-oxodG with urine matrix.
Analysis of 8-oxodG in the Urine
A total of 9 urine samples from individual subjects were analyzed for their levels of 8-oxodG as an oxidative marker by both ELISA and HPLC-MS/MS. A representative HPLC-MS/MS chromatogram for the detection of urinary 8-oxodG is shown in Figure 3. The results of urinary levels of 8-oxodG obtained by both methods are summarized in Table 1. Among the 9 urine samples we analyzed, the average level of 8-oxodG was 6.2 ± 2.2 ng/mL urine or 1.4 ± 0.3 nmol/mmol creatinine by HPLC-MS/MS with SPE purification. In Experiment 1, results from the Cayman kit were compared with those from HPLC-MS/MS method and results were expressed as ng/mL urine. In Experiment 2, all three ELISA kits and HPLC-MS/MS were compared and results were standardized with creatinine to simplify the comparison procedure. In Experiment 1, results obtained from ELISA after SPE were 13.7-fold higher than those from HPLC-MS/MS. In Experiment 2, the average levels obtained by ELISA without SPE purification were 2.3-fold, 2.6-fold and 4.7-fold higher than after SPE for Cayman, ENZO and Abcam kits, respectively. All ELISA results were 7.6- to 23.5-fold higher than those obtained by HPLC-MS/MS. Levels of variation as assessed by %CV were substantially lower for HPLC-MS/MS than for ELISA.
Figure 3.A representative chromatogram of the detection of urinary 8-oxodG obtained from stable isotope dilution HPLC-MS/MS analysis of urine from human subjects. The HPLC trace of internal standard is indicated in red, and the HPLC trace of 8-oxodG in the analyzed sample is indicated in blue.
| 8-oxodG concentration | |||||
| Without SPE* | With SPE* | ||||
| Method(units) | Mean ± SD | %CV | Mean ± SD | %CV | |
| Experiment 1 | HPLC-MS/MS(ng/mL urine) | 6.2 ± 2.2 | 35.5 | ||
| Cayman(ng/mL urine) | 85.2 ± 44.7 | 52.5 | |||
| Experiment 2 | HPLC-MS/MS(nmol/mmol creatinine) | 1.4 ± 0.3 | 21.4 | ||
| Cayman(nmol/mmol creatinine) | 77.0 ± 40.5 | 52.6 | 33.0 ± 14.6 | 44.2 | |
| ENZO(nmol/mmol creatinine) | 38.6 ±23.3 | 60.4 | 14.7 ± 9.8 | 66.7 | |
| Abcam(nmol/mmol creatinine) | 49.9 ± 36.4 | 74.9 | 10.7 ± 10.7 | 100 | |
To compare results obtained from the different ELISA kits, we performed both paired sample T tests as well as correlational analyses (Table 2, Figure 4). Figure 4A, Figure 4B, Figure 4C showed their associations without SPE purification, and Figure 4D, Figure 4E, Figure 4F, are with SPE purification. In general, we found that results differed between kits with the exception of Abcam and ENZO, where the levels with significantly correlated between kits either with or without SPE purification (P<0.002) (Figure 4C and Figure 4F). However, despite this correlation, a significant difference in levels was observed between the two kits after SPE purification by paired T-test (P = 0.0001) (Table 2). The measurements between kits from Cayman and ENZO were also different both with SPE (P = 0.0182) and without SPE (P = 0.0065) purification by paired T-test.
Figure 4.Correlations of levels of urinary 8-oxodG from human subjects between samples (A) analyzed by ELISA (ENZO) and ELISA (Cayman) without SPE, (B) analyzed by ELISA (Abcam) and ELISA (Cayman) without SPE, (C) analyzed by ELISA (Abcam) and ELISA (ENZO) without SPE, (D) analyzed by ELISA (ENZO) and ELISA (Cayman) with SPE, (E) analyzed by ELISA (Abcam) and ELISA (Cayman) with SPE, and (C) analyzed by ELISA (Abcam) and ELISA (ENZO) with SPE.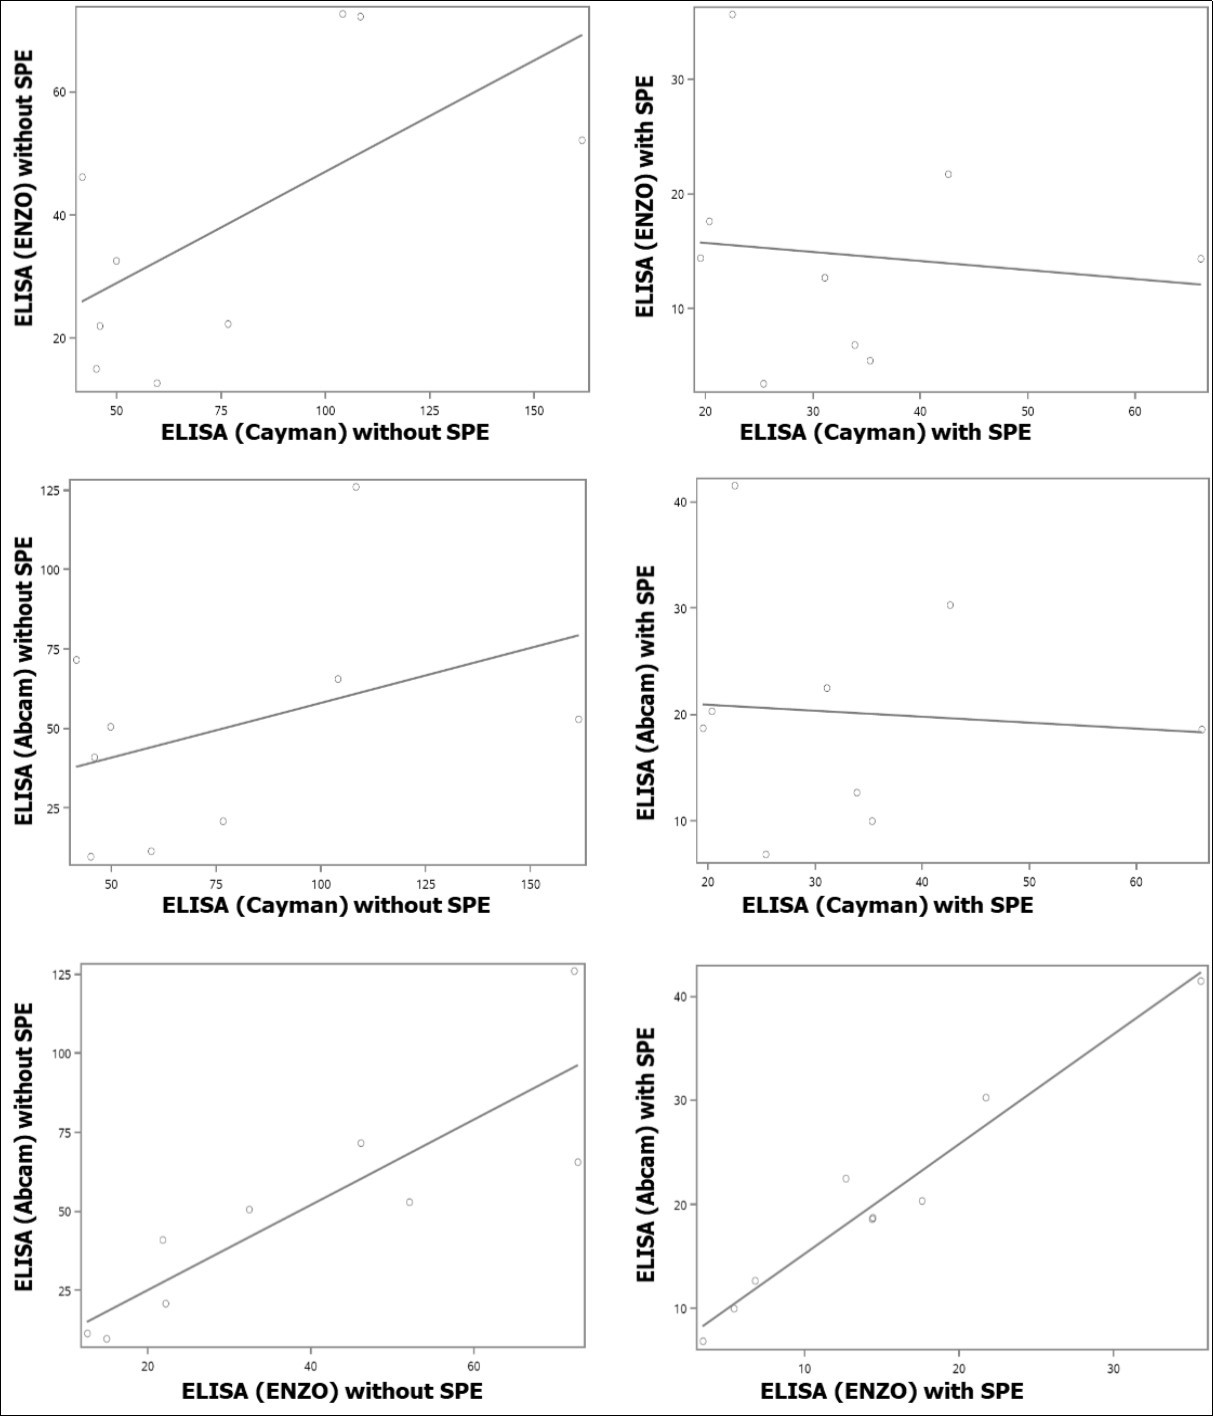
| Pairs of measures | SPE* | p-value for spearman correlation | P-value for paired-sample T-test | correlation |
| ELISA (Cayman) vs ELISA (ENZO) | No | P=0.1250 | P=0.0065 | See Fig 4A |
| Yes | P=0.5755 | P=0.0182 | See Fig 4D | |
| ELISA (Cayman) vs ELISA (Abcam) | No | P=0.3807 | P=0.0937 | See Fig 4B |
| Yes | P=0.6682 | P=0.0737 | See Fig 4E | |
| ELISA (ENZO) vs ELISA (Abcam) | No | P=0.0016 | P=0.1254 | See Fig 4C |
| Yes | P=0.0009 | P=0.0001 | See Fig 4F | |
| ELISA (Cayman) vsHPLC-MS/MS | No | P=0.7139 | P=0.0005 | See Fig 5A |
| Yes | P=0.4841 | P=0.0002 | See Fig 5D | |
| ELISA (ENZO) vsHPLC-MS/MS | No | P=0.2817 | P=0.0013 | See Fig 5B |
| Yes | P=0.0086 | P=0.0032 | See Fig 5E | |
| ELISA (Abcam) vsHPLC-MS/MS | No | P=0.0596 | P=0.0038 | See Fig 5C |
| Yes | P=0.0473 | P=0.0006 | See Fig 5F | |
| *only applied to ELISA kits. All samples analyzed by HPLC-MS/MS were pre-purified by SPE. | ||||
We also examined the association between the urinary 8-oxodG levels measured by the three ELISA kits vs. those measured by HPLC-MS/MS (Table 2, Figure 5). As determined by paired T tests, levels determined by each ELISA procedure were significantly different from those obtained by HPLC-MS/MS. However, significant correlations were observed for some kits. Overall, the correlations were improved after SPE purification with the levels measured using the kits from ENZO (P = 0.2817 without SPE; P = 0.0086 with SPE) and Abcam (P = 0.0596 without SPE; P = 0.0473 with SPE). No correlation was found even after SPE purification for the levels measured by kit from Cayman vs. by HPLC-MS/MS.
Figure 5.Correlations of levels of urinary 8-oxodG from human subjects between samples (A) analyzed by HPLC-MS/MS and ELISA (Cayman, without SPE), (B) analyzed by HPLC-MS/MS and ELISA (ENZO, without SPE), (C) analyzed by HPLC-MS/MS and ELISA (Abcam, without SPE), (D) analyzed by HPLC-MS/MS and ELISA (Cayman, with SPE), (E) analyzed by HPLC-MS/MS and ELISA (ENZO, with SPE), and (F) analyzed by HPLC-MS/MS and ELISA (Abcam, with SPE).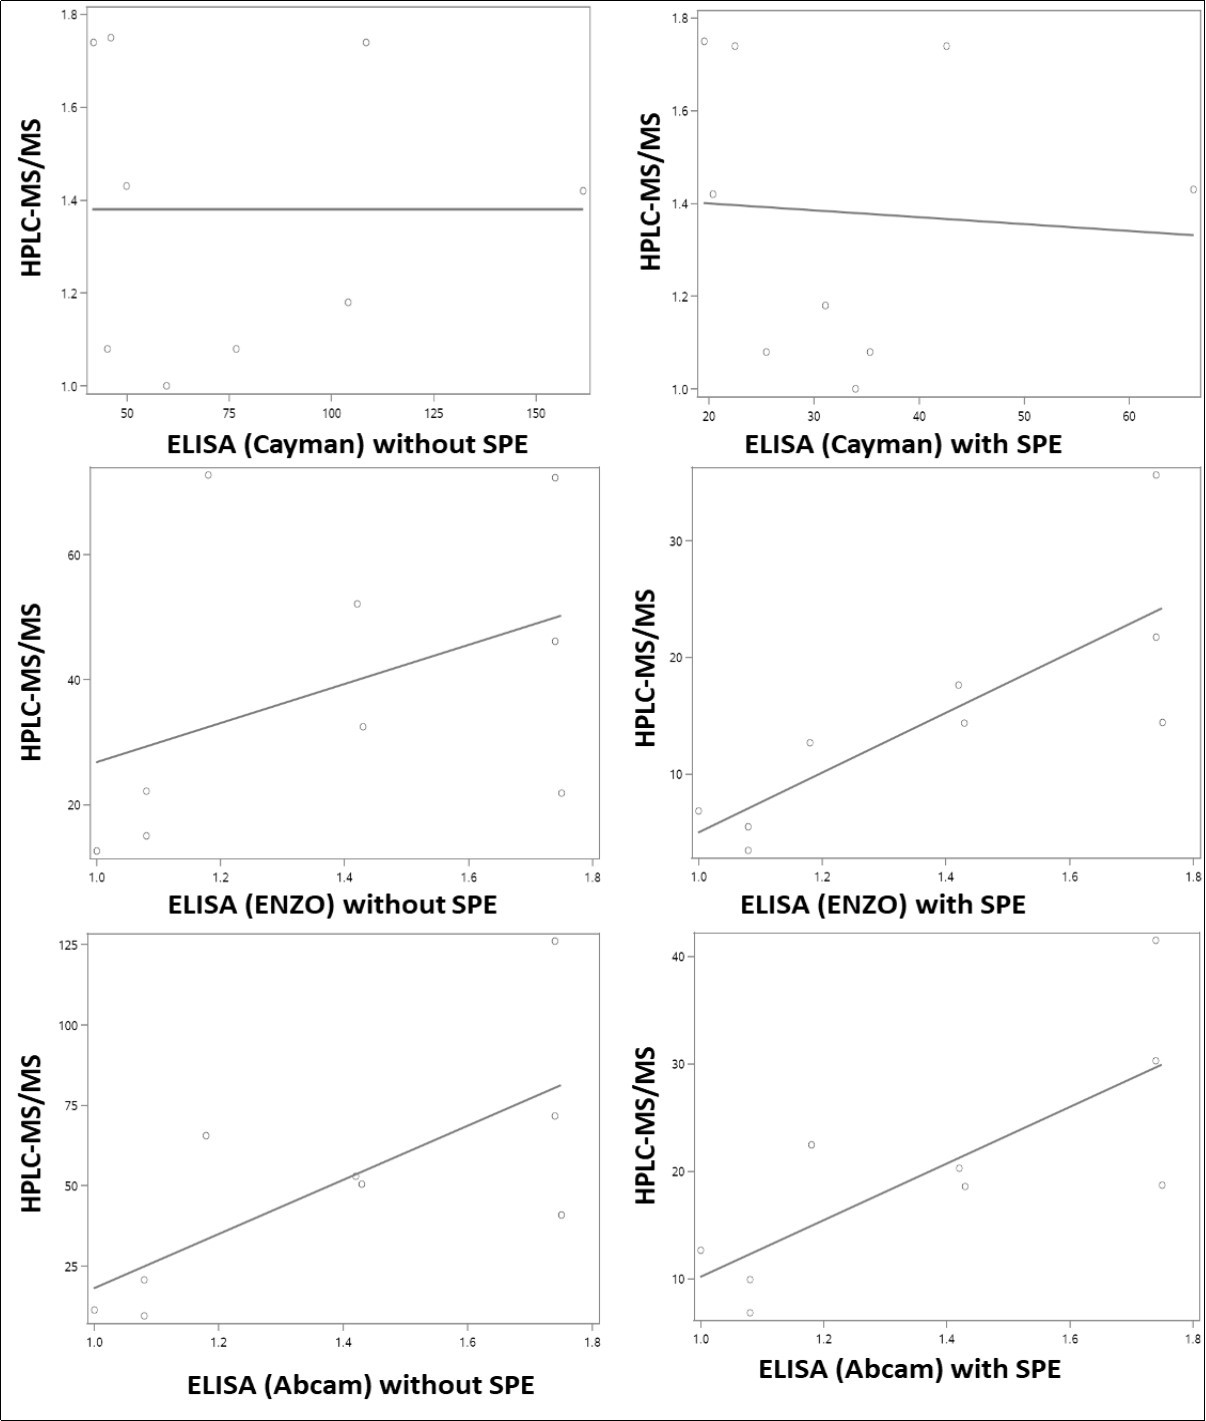
Discussion
Urinary 8-oxodG is a commonly used biomarker of oxidative damage to DNA and overall oxidative stress in animal models and in clinical investigations. While HPLC methods are clearly superior for accurate quantification and structural confirmation, ELISA methods are often used based on their ease of use, higher throughput and lower costs; key factors for studies involving large numbers of samples. However, since several studies have brought into question the accuracy and precision of available ELISA techniques, results from studies using this methodology have been questioned 24, 25, 26, 27, 28. In order to provide unbiased comparison between the two methods, we have conducted side-by-side analyses of urinary 8-oxodG using HPLC-MS/MS and three commonly used commercially available ELISA kits with sample purification techniques which allow for the valid comparisons across methods. Results suggest that the ELISAs tested do not allow for an accurate determination of 8-oxodG likely as a result of cross-reactivity with related compounds in urine. However, two of the ELISA methods resulted in values which were significantly correlated with those obtained by HPLC-MS/MS, particularly after SPE purification. Thus, these ELISAs may find utility as general oxidative stress markers while lacking selectivity for 8-oxodG.
The SPE method used in this study was previously reported to have a 88% recovery of 8-oxodG 29, and it is 98% in our experiment. Therefore, the addition of internal standard post SPE purification would result in an under-estimation of the urinary level of 8-oxodG by HPLC-MS/MS analysis. However, the urinary levels of 8-oxodG we detected by HPLC-MS/MS are still comparable with reported data 15, 29, 30. For a direct comparison between the urinary levels of 8-oxodG analyzed by the selected ELISA kits and HPLC-MS/MS, urine samples were purified by SPE before the addition of internal standard. Although we understand that the internal standard should be added before SPE purification to accurately determine the urinary levels of 8-oxodG by HPLC-MS/MS, we want to emphasize that to give a unbiased comparison between HPLC-MS/MS and ELISA, the internal standard should be added after.
It is not a surprise that the ELISA kits employed in this study detected higher level of 8-oxodG in the urine because it has been observed that the antibodies used for 8-oxodG detection can react with numerous oxidized guanine species; 8-oxodG from DNA, 8-hydroxyguanosine from RNA, and 8-hydroxyguanine from either DNA or RNA, even if they are more specific to 8-oxodG. In addition, it was reported that other high molecular weight components in urine may also contribute to this disagreement 31. In the current study, the results obtained using these selected ELISA kits showed only 43% (Cayman), 38% (ENZO) and 21.4% (Abcam) recoveries after SPE purification (Table 1), further supporting that lack of selectivity of the ELISA methods for 8-oxodG.
We anticipated that the levels of 8-oxodG in urine samples analyzed by ELISA after SPE purification would have a better association with those analyzed by HPLC-MS/MS based on a previous report 15; the authors demonstrated that purification of urine samples by SPE can improve the correlation between these two methods. However, a recent report from this group showed that ELISA still cannot be considered as a robust alternative to HPLC-MS/MS after an inter-laboratory comparison (18]. Our results indicate that the levels of this oxidative stress marker in urine detected by these selected ELISA kits are higher than those analyzed by HPLC-MS/MS after SPE purification; however, the SPE purification did improve the correlation between these two methods in at least two of the ELISA kits used in this study. This is the first time that these three ELISA kits were evaluated against LC-MS method. Therefore, our data further demonstrated and proved that the chromatographic method is more accurate and sensitive than the ELISA.
Conclusion
We conclude that the SPE purification can improve the correlation between the selected ELISA kits and HPLC-MS/MS, but HPLC-MS/MS is still the method of choice to assess the accurate levels of urinary 8-oxodG.
Funding
This work was supported in part by the National Institute on Drug Abuse of the National Institutes of Health and the Center for Tobacco Products of the U.S. Food and Drug Administration (under Award Number P50-DA-036107), NCI (R01-CA173465) and NIEHS ( R21ES020411) of the National Institutes of Health. The content is solely the responsibility of the authors and does not necessarily represent the official views of the National Institutes of Health or the Food and Drug Administration.
References
- 1.S F Lee, Pervaiz S. (2011) Assessment of oxidative stress-induced DNA damage by immunoflourescent analysis of 8-oxodG;. , Methods Cell Biol 103, 99-113.
- 2.A Di Minno, Turnu L, Porro B, Squellerio I, Cavalca V et al. (2016) 8-Hydroxy-2-Deoxyguanosine Levels and Cardiovascular Disease: A Systematic Review and Meta-Analysis of the Literature; Antioxidants & redox signaling;. 24, 548-555.
- 3.Il'yasova D, Scarbrough P, Spasojevic I. (2012) Urinary biomarkers of oxidative status;. , Clin Chim Acta 413, 1446-1453.
- 4.David S S, O'Shea V L, Kundu S. (2007) Base-excision repair of oxidative DNA damage;. , Nature 447, 941-950.
- 5.Valavanidis A, Vlachogianni T, Fiotakis C. (2009) 8-hydroxy-2' -deoxyguanosine (8-OHdG): A critical biomarker of oxidative stress and carcinogenesis;. , J Environ Sci Health C Environ Carcinog Ecotoxicol Rev; 27, 120-139.
- 6.N L Chepelev, D A Kennedy, Gagne R, White T, A S Long et al. (2015) HPLC Measurement of the DNA Oxidation Biomarker, 8-oxo-7,8-dihydro-2'-deoxyguanosine, in Cultured Cells and Animal Tissues; Journal of visualized experiments : JoVE;. 52697.
- 7.Ma B, Jing M, P W Villalta, R J Kapphahn, S R Montezuma et al. (2016) Simultaneous determination of 8-oxo-2'-deoxyguanosine and 8-oxo-2'-deoxyadenosine in human retinal DNA by liquid chromatography nanoelectrospray-tandem mass spectrometry; Scientific reports;. 6, 22375.
- 8.Singh R, Kaur B, Kalina I, T A Popov, Georgieva T et al. (2007) Effects of environmental air pollution on endogenous oxidative DNA damage in humans; Mutation research. 620, 71-82.
- 9.I D Podmore, Cooper D, M D Evans, Wood M, Lunec J. (2000) Simultaneous measurement of 8-oxo-2'-deoxyguanosine and 8-oxo-2'-deoxyadenosine by HPLC-MS/MS; Biochemical and biophysical research communications;. 277, 764-770.
- 10.Weimann A, Belling D, H E Poulsen. (2001) Measurement of 8-oxo-2'-deoxyguanosine and 8-oxo-2'-deoxyadenosine in DNA and human urine by high performance liquid chromatography-electrospray tandem mass spectrometry; Free radical biology & medicine;. 30, 757-764.
- 11.El-Bayoumy K, Y H Chae, J G Rosa, L K Williams, Desai D et al. (2000) The effects of 1-nitropyrene, 2-amino-1-methyl-6-phenylimidazo[4,5-b]pyridine and 7,12-dimethylbenz[a]anthracene on 8-hydroxy-2'-deoxyguanosine levels in the rat mammary gland and modulation by dietary 1,4-phenylenebis(methylene) selenocyanate; Cancer letters. 151, 7-13.
- 12.E S Fiala, R S Sodum, Bhattacharya M, Li H. (1996) (-)-Epigallocatechin gallate, a polyphenolic tea antioxidant, inhibits peroxynitrite-mediated formation of 8-oxodeoxyguanosine and 3-nitrotyrosine; Experientia;. 52, 922-926.
- 13.Rota C, Cristoni S, Trenti T, Cariani E. (2013) A serially coupled stationary phase method for the determination of urinary 8-oxo-7, 8-dihydro-2'-deoxyguanosine by liquid chromatography ion trap tandem mass spectrometry; Redox biology;. 1, 492-497.
- 14.C W Hu, M T Wu, M R Chao, C H Pan, C J Wang et al. (2004) Comparison of analyses of urinary 8-hydroxy-2'-deoxyguanosine by isotope-dilution liquid chromatography with electrospray tandem mass spectrometry and by enzyme-linked immunosorbent assay; Rapid Commun Mass Spectrom;. 18, 505-510.
- 15.Rossner P, Mistry V, Singh R, R J Sram, M S Cooke. (2013) Urinary 8-oxo-7, 8-dihydro-2'-deoxyguanosine values determined by a modified ELISA improves agreement with HPLC-MS/MS; Biochemical and biophysical research communications. 440, 725-730.
- 16.Cadet J, Davies K J A, M H, P Di Mascio, J R Wagner. (2017) Formation and repair of oxidatively generated damage in cellular DNA; Free radical biology & medicine. 107, 13-34.
- 17. (2000) Comparison of different methods of measuring 8-oxoguanine as a marker of oxidative DNA damage. ESCODD (European Standards Committee on Oxidative DNA Damage); Free radical research;. 32, 333-341.
- 18.Rossner P, Orhan H, Koppen G, Sakai K, R M Santella et al. (2016) Urinary 8-oxo-7, 8-dihydro-2'-deoxyguanosine analysis by an improved ELISA: An inter-laboratory comparison study; Free radical biology & medicine;. 95, 169-179.
- 19.M D Evans, Olinski R, Loft S, M S Cooke. (2010) Toward consensus in the analysis of urinary 8-oxo-7,8-dihydro-2'-deoxyguanosine as a noninvasive biomarker of oxidative stress; Faseb J;. 24, 1249-1260.
- 20.M S Cooke, Singh R, G K Hall, Mistry V, T L Duarte et al. (2006) Evaluation of enzyme-linked immunosorbent assay and liquid chromatography-tandem mass spectrometry methodology for the analysis of 8-oxo-7,8-dihydro-2'-deoxyguanosine in saliva and urine; Free radical biology & medicine;. 41, 1829-1836.
- 21.Rossner P, Svecova V, Milcova A, Lnenickova Z, Solansky I et al. (2007) Oxidative and nitrosative stress markers in bus drivers; Mutation research. 617, 23-32.
- 22.Singh R, McEwan M, J H Lamb, R M Santella, P B Farmer. (2003) An improved liquid chromatography/tandem mass spectrometry method for the determination of 8-oxo-7, 8-dihydro-2'-deoxyguanosine in DNA samples using immunoaffinity column purification; Rapid Commun Mass Spectrom;. 17, 126-134.
- 23.R J Mitchell. (1973) Improved method for specific determination of creatinine in serum and urine; Clin Chem;. 19, 408-410.
- 24.Rossner P, Orhan H, Koppen G, Sakai K, R M Santella et al. (2016) Urinary 8-oxo-7, 8-dihydro-2'-deoxyguanosine analysis by an improved ELISA: An inter-laboratory comparison study; Free radical biology & medicine;. 95, 169-179.
- 25.M S Cooke, Olinski R, Loft S. (2008) Measurement and meaning of oxidatively modified DNA lesions in urine; Cancer Epidemiol Biomarkers Prev;. 17, 3-14.
- 26.Barregard L, Moller P, Henriksen T, Mistry V, Koppen G et al. (2013) Human and methodological sources of variability in the measurement of urinary 8-oxo-7, 8-dihydro-2'-deoxyguanosine; Antioxidants & redox signaling;. 18, 2377-2391.
- 27.M S Cooke, Barregard L, Mistry V, Potdar N, Rozalski R et al. (2009) Interlaboratory comparison of methodologies for the measurement of urinary 8-oxo-7,8-dihydro-2'-deoxyguanosine; Biomarkers;. 14, 103-110.
- 28.L W Garratt, Mistry V, Singh R, J K Sandhu, Sheil B et al. (2010) Interpretation of urinary 8-oxo-7,8-dihydro-2'-deoxyguanosine is adversely affected by methodological inaccuracies when using a commercial ELISA; Free radical biology & medicine;. 48, 1460-1464.
- 29.P M Lam, Mistry V, T H Marczylo, J C Konje, M D Evans et al. (2012) Rapid measurement of 8-oxo-7,8-dihydro-2'-deoxyguanosine in human biological matrices using ultra-high-performance liquid chromatography-tandem mass spectrometry; Free radical biology & medicine;. 52, 2057-2063.
Cited by (3)
- 1.Elkama Aylin, İlik Nazlican, Şentürk Kerem, Karahalil Bensu, 2025, Biomonitoring cytogenetic and oxidative-stress related damage in gas station attendants: Buccal micronucleus cytome assay and serum 8-OHdG levels, Archives of Environmental & Occupational Health, 80(7-8), 165, 10.1080/19338244.2025.2520850
- 2.Sun Yuan-Wan, Chen Kun-Ming, Atkins Hannah, Aliaga Cesar, Gordon Terry, et al, 2021, Effects of E-Cigarette Aerosols with Varying Levels of Nicotine on Biomarkers of Oxidative Stress and Inflammation in Mice, Chemical Research in Toxicology, 34(4), 1161, 10.1021/acs.chemrestox.1c00033
- 3.Tiso Francesca, in 't Hout Florentien E. M., Knops Ruth, Kroeze Leonie I., van Rooij Arno, et al, 2025, High levels of global hydroxymethylation predict worse overall survival in MDS patients treated with azacitidine, HemaSphere, 9(1), 10.1002/hem3.70034