Abstract
The COVID-19 pandemic has killed more than 400 thousand and infected more than 7 million people in the whole world as of 06/10/2020. Many open systems, such as educations, transportations, entertainments, sports or foods, have been completely or partially locked down in many regions of the world to prevent COVID-19 spreading. Therefore, how to reopen all of the open systems after the shutdown has become a world urgent issue.
Evidences of COIVD-19 have showed: person-to-person transmission occurs among close contacts; virus droplets (or aerosols) play an important role in the transmission; people can prevent COVID-19 by measures of mask-wearing or maintaining social distancing. However, how these measures work to prevent COVID-19 is still not clear in a perspective of biomedical Infophysics.
In this study, (1) we think the transmission of infection can be accomplished by real or virtual person; (2) we define a virtual person as ghost airflow, a term we coin to describe virus droplets (or aerosols) that are initially generated by human carriers and remain in the air to be transmitted. These ghost airflows are as dangerous as the real virus carriers particularly in enclosed (confined) environments; (3) we propose biomedical infophysical models (BMIPM) of filtering the ghost airflows by mask-wearing and maintaining social distancing, to help people to understand the filtering mechanisms and willingly follow the guidelines of preventing covid-19, and therefore to successfully reopen all of the open systems after the shutdowns (lockdowns) and (or) to avoid the shutdowns (lockdowns) in future epidemics or pandemics.
Significantly, we compare the prevention efficiencies of COVID-19 between people who are accustomed and not accustomed to masks based on the published WHO, CDC or NHC pandemic data. The compared results support our models in this investigation.
Coronaviruses easily survive and have high toxicity, in dirty, wet and cold environments, and the air pollution is linked with higher COVID-19 death rates. The dingy environments and air-conditioning, freezing systems sufficiently provide such necessary dirty, wet and cold conditions and polluted airflows to exacerbate the mortality rate of COVID-19. Therefore, we strongly suggest: to use air conditioners as less as possible, to turn the wind levels as low as possible and to clean (disinfecting) the air-conditioning systems (filters and channels) and environments as frequent as possible.
Author Contributions
Copyright © 2020 Kang Cheng, et al.
 This is an open-access article distributed under the terms of the Creative Commons Attribution License, which permits unrestricted use, distribution, and reproduction in any medium, provided the original author and source are credited.
Competing interests
The authors have declared that no competing interests exist.
Citation:
Introduction
COVID-19 pandemic has killed more than 400 thousand and infected about 7 million of people in the whole world as of 06/10/2020 1. Many open systems, such as educations, transportations, entertainments, sports or foods, have been completely or partially shut down or locked down in many regions of the world to prevent COVID-19 spreading. Therefore, how to reopen all of the open systems after the shutdown has become a world urgent issue.
Evidences of COIVD-19 have showed that person-to-person transmission occurs among close contacts and the virus droplets (or aerosols) play an important role in the transmission 3, 4, 5, 6.
In the middle of February 2020, we urgently suggested American people to wear masks to prevent the respiratory infectious diseases 3. We believe the people would have significantly reduced the death rate of COVID-19 pandemic if they had worn the masks early.
WHO (World Health Organization) 1, CDC (Centers for Disease Control and Prevention) 2, 7 and NHC (National Health Commission of China) 8 have issued precautions or measures to prevent COVID-19 transmission, such as washing hands frequently, maintaining social distancing, wearing face masks (covers) properly.
People can prevent COVID-19 by measures of mask-wearing or maintaining social distancing 1, 2. However, how these measures work to prevent COVID-19 is not clear from a perspective of biomedical Infophysics.
In this study, we propose biomedical infophysical models (BMIPM) of filtering ghost airflows (GAF) through mask-wearing and maintaining social distancing, to help people to understand the filtering mechanisms and willingly follow WHO or CDC guidelines of preventing covid-19, and therefore to successfully reopen the systems after the shutdowns (lockdowns) and (or) to avoid the shutdowns (lockdowns) in future epidemics or pandemics. To our knowledge, there is not any published model like ours.
Medical and surgical masks were invented in Europe about 100 years ago 9, 10 and they are successfully applied in hospitals. However, most people in Europe and America are not used to wearing face masks. In contrast, most Eastern Asian people are used to wear face masks (covers) to protect their faces, nostrils and mouths from winds, sands, dusts and pollutions. Thus, they easily accept the wearing of masks to prevent respiratory infectious diseases 3, 11, as seen with well efficient prevention of COVID-19 today 1.
In this article, we compare the prevention efficiencies of COVID-19 between people who are used to and not used to wearing masks, based on published WHO 1, CDC 2 or NHC 8 pandemic data. The results from this comparison support our models; we also believe our models are applicable (suitable) to prevent other respiratory infectious diseases.
Methods
Models
Prevention Efficiencies of Maintaining Social Distancing and Mask-Wearing Measures
The functional value of maintaining distancing and mask-wearing are evaluated through the efficiency of a mask’s filtering efficiency. Previous findings suggest that a homemade mask should only be considered as a last resort to prevent droplet transmission from infected individuals, and that it would be better than no protection 12.
A recent study that examined the capacity for a range of types of cloth masks to filter particulate matter of 10 um or less (PM10) found that four different types had filtering efficiencies that ranged from 63% to 84% 13.
We think, another important prevention effect of mask-wearing is to keep your nose and mouth from being touched by your infected hands.
The sizes of O2 and CO2 molecules are smaller than 1 nm 18. We assume, when most people breath normally, that while more than 90% of O2 and CO2 molecules can pass through (cloth) face masks/covers, only 50% of COVID-19 droplets can pass 13, because the COVID-19 droplet sizes are about 10 nm – 500 um 13, 14.
We simplify the distributed-element of maintaining social distancing as a lumped-element to describe the transmission of COVID-19 droplets through the air medium. Figure 1 to Figure 2, Figure 3, Figure 4, Figure 5 illustrate our model of equivalent transmission pathways or waveguides 23. The models describe using masks or social distancing as prevention measures for transmission between a virus carrier and a non-infected individual; the virus carrier can be a real or virtual person.
Figure 1.Equivalent person to person transmission (incident, reflected, transmitted and scattered) pathways or waveguides. Virus carrier and non-infected person maintain social distancing only; none wears a mask. The drawing is not to the scale.
Figure 2.Equivalent person to person transmission (incident, reflected, transmitted and scattered) pathways or waveguides. Only the non-infected person wears a face mask and social distancing is not maintained.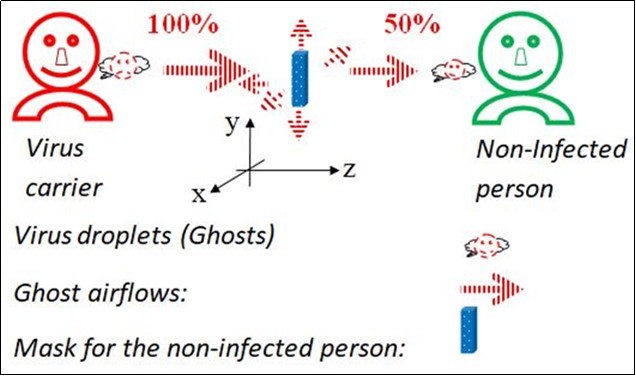
Figure 3.Equivalent person to person transmission (incident, reflected, transmitted and scattered) pathways or waveguides. Only the non-infected person wears a face mask; social distancing is maintained.
Figure 4.Equivalent person to person transmission (incident, reflected, transmitted and scattered) pathways or waveguides. Both persons wear face masks and do not maintain social distancing.
Figure 5.Equivalent person to person transmission (incident, reflected, transmitted and scattered) pathways or waveguides. Both persons wear face masks and maintain social distancing.
We define virtual persons as ghost airflows, a term we coin to describe virus droplets (or aerosols) that are initially generated by human carriers and remain in the air to be transmitted. The viral ghost airflows can be generated naturally (virus transmitted through coughing, speaking) or artificially (virus carried through air-conditioning, fan). The ghost airflows form after the real virus carriers release virus droplets into the flowing air; regardless of whether the real virus carriers are still present or not, assisted with the winds or air gusts, ghost airflows can exist for up to three hours 24.The ghost airflows are as dangerous as the real virus carriers in enclosed (confined) environments, such as inside of rooms, airplanes, trains, buses, cruises.
We assume (Figure 1): neither the virus carrier nor non-infected person wears a face mask (cover or filter) measure; they only maintain social distancing measure; the prevention efficiency is 50%, meaning the non-infected person inhales 50% of the droplets from the virus carrier; in comparison, the prevention efficiency of no precautionary measures is 0%.
In Figure 2 we assume that only the non-infected person wears a mask and social distancing is not maintained; here, the prevention efficiency of the measure is 50% too; in comparison prevention efficiency of no precautionary measures is 0%. This means the non-infected person also inhales 50% of the droplets from the virus carrier in Figure 2. We will not draw a separate figure for the scenario where, only the virus carrier wears a mask with no social distancing as its model and prevention efficiency is similar to that of Figure 2.
In Figure 3,we describe a scenario where either the carrier or non-infected individual wears a mask and social distancing is also maintained. Based on the models in Figure 1 and Figure 2 we calculate to prevention efficiency to be 75% (100% - 50% x 50%), and the amount of viral droplets inhaled by the non-infected person to be 25% (100% - 75%).
In Figure 4, we describe a scenario where people are in crowded environments, such as that of classrooms, stadiums, restaurants, airplanes, trains, buses or cruises. Here, they can still have a 75% (100% - 50% x 50%) prevention efficiency and the non-infected person inhales only 25% (100% - 75%) of the droplets from the virus carrier as long as the carrier and non-infected person both wears face masks/covers even if social distancing is not maintained.
Based on the above modeling equations and calculating results, we can see that the measure of mask-wearing plays a more efficient, significant and practical role than the measure of social distancing, in COVID-19 prevention, especially in crowded or enclosed (confined) environments; in crowded areas, there is not enough space to maintain social distancing and in confined environments, ghost airflows create a significant transmission risk.
In Figure 5, we describe an optimum scenario where both the carrier and non-infected individual wear masks and also keep social distancing. The calculated prevention efficiency of that situation is 87.5% (100% - 50% x 50% x 50%) and the non-infected person inhales only 12.5% (100% - 87.5%) of the droplets from the virus carrier.
Obviously, for human autoimmune systems or medical treatments, it is much easier to defeat reduced amounts of virus droplets (12.5%, 25% or 50%) than 100% of the virus droplets. We believe mask-wearing measures are the key to answer why people who are accustomed to wearing masks are preventing COVID-19 pandemic more efficiently than those who are not.
Of course, sick or weak people should stay home to minimize risks of serious infection and death because their immunological systems are less efficient than that of the healthy people. We strongly suggest that sick or weak persons wear masks at home during the infectious season or during periods of possible infection, to prevent COVID-19, just in case they get infection from family members, guests or ghost airflows.
Using Newton’s Second Law to Describe Spreading and Reverberating of Virus Droplets (Ghost Airflows)
We think Newton’s second law (momentum transfer equation) is a suitable equation to approximately describe the spreading and reverberating of the virus droplets, O2, or CO2 through medium materials (such as masks or air distances) with external forces (natural coughing/talking or artificial winds or gusts of air). According to Newton’s second law, we modify a basic equation in hydro- and aerodynamic applications as 22,
 (1)
(1)
Where, subscript i = 1, 2, 3, …, and denotes different substances, such as virus droplets (or aerosols), O2 or CO2; ri, vi and pi respectively denote the mass density, velocity and pressure; rividenotes the mass flux or momentum; Fi and fi respectively denote the body force and friction, per unit mass, acting on the mass contained within the region; the mass density, velocity, pressure and forces are functions of space - time coordinates, temperature and humidity; and the gradient operator is,
 (2)
(2)
Where, letters in hats denote unit vectors for the partial differential operators.
In this study, we consider only spatial and time variables. Therefore, our modeling equation 1 is simplified to a 4 dimensional (4D) model.
Based on equation 1, natural gusts of air, such as coughing, loud speaking, or strong respiration (exhalation or inhalation); or artificial winds or gusts of air, such as air-conditioning, fans, can increase the force Fi and (or) negative gradient pi; the increased force Fi and (or) negative gradient pi raises the droplet momentum rivi; the raised rivi increases spreading range. Therefore, the larger (longer) the spreading region, the stronger the infectivity (infectant power).
Also based on equation 1, the measures of mask-wearing or maintaining social distancing increases the friction fi; the increased fi decreases the droplet momentum rivi; the decreased rivi reduces spreading range. Usually, the longer (thicker or denser) the distance (mask), the smaller the momentum of the transmitted droplets, therefore, the narrower (shorter) the virus spreading region; and the weaker the infectivity (infectant power).
The masks should have appropriate densities and thickness to maintain required friction, to reduce the spreading ranges; a balance between reducing the spreading ranges and keeping normal respiration should be optimized.
In enclosed or confined environments, possible solutions of equation 1can be reverberating or oscillating waves of the ghost airflows(virus droplets) in time domain.
Assisted with winds or gusts of air, the ghost airflows can reverberate (oscillate) for long periods of time 24 in the enclosed or confined environments, travel long distances into people's respiratory systems to directly infect people, as well as come into contact with things to indirectly infect people 3. Therefore, in the enclosed (confined) environments, these oscillating waves should be minimized and mask-wearing measures play a more efficient, significant and practical role than social distancing to prevent COVID-19.
Importantly, in order to minimize the incident wave 19 of any ghost airflows that enter the masks (or nasal cavity or mouth), people should avoid too closing and directly facing to all outlets of natural (human respiratory) or artificial (AC, fans) winds or gusts. Speaking softly or adjusting the AC wind or gust levels as low as possible can also help.
Equation1 is a point form of the mass flux. We can obtain a related integral form as the following equation,
 (3)
(3)
Where, we define Mi(z) as a total mass of some substances, such as virus droplets, O2, or CO2,at the coordinate z (Figure 1 to Figure 2, Figure 3, Figure 4) during an interval time; the inner integration in spatial domain (x and y) is a mass flow, the most important location z is at the nose or mouth, the integral depends on sizes of the opening mouth or (and) nostrils that directly correlate inhaling and exhaling rates of the substances; the external integration in time domain (t) depends on the duration of the mass flow, the most important time interval is the inhaling duration that directly correlates the inhaled amount of the viruses. Obviously, the larger the sizes or the longer the inhaling duration, the more the inhaled viruses.
Based on modeling equations 1 and 3, we can assume that the less virus a person inhales or the healthier a person is, the easier the recovery from infection.
Therefore, we suggest that medical or healthcare workers who are treating patients with COVID-19 should limit their working hours; patients with COVID-19 should take more rest, drink more water and nutrients, and reserve energies as much as possible to fight the viruses in their bodies, rather than to do exercises. In potentially infected environments, all people should wear masks, eat foods as quick as possible (such as at schools, in transportations, or restaurants), rest while wearing masks, or do exercises while maintaining social distancing in uninfected or wide openly ventilated fields (such as beaches or parks).
Using Fick’s Laws to Describe Spreading and Reverberating of Virus Droplets (Ghost Airflows)
Fick's laws elucidate how particles under random thermal motion diffuse from a higher concentration space to a lower concentration space 20, 21, 22.
We think Fick’s laws are suitable to approximately describe the thermodynamic spreading and reverberating of the virus droplets, O2 or CO2 through medium materials (such as masks or air distances). Equation 4 is our modified multiple dimensional Fick’s first law 20 – 22,
 (4)
(4)
Where, subscript i = 1, 2, 3, …, and denotes different substances, such as the virus droplets (or aerosols) O2 or CO2; Ji and ri respectively denote diffusion fluxes and densities; Di denotes the correspondent diffusion coefficients (depends on the properties of the medium and temperature), is decreased by the mask or air substances, and is roughly a constant for a specific medium in this investigation; x, y, z, t respectively denote spatial and time coordinates; T and H respectively denote temperature and humidity.
In this study, we consider only spatial and time variables. Therefore, our modeling equation 1 is simplified to a 4 dimensional (4D) model:
 (5)
(5)
Based on equations 4 - 5, the mask-wearing and maintaining social distancing measures decrease the droplet diffusion flow Ji because of reduced Di; the decreased Ji reduces the spreading amount. Usually, the longer (thicker or denser) the distance (mask), the less the droplet diffusion flow, therefore, the weaker the infectivity (infectant power) and higher the prevention efficiency. We emphasize again, a balance between reducing the droplet diffusion and keeping normal respiration should be optimized for the mask materials.
Equation 5 is a point form of the diffusion. We can obtain a related integral form as the following equation,
 (6)
(6)
Where, we define Qi(z) as a total quantity of some substances, such as virus droplets, O2, or CO2,at the coordinate z (Figure 1 to Figure 2, Figure 3, Figure 4, Figure 5) during an interval time. The analysis of equation 6 is the same as or similar to that of equation 3.
When the diffusion is neither absorbed nor emitted by the medium, we obtained the equation of continuity that is also the conservation law of substance and is equivalent to Fick’s second law, using divergence theorem 21 and equations 2 and 5:
 (7)
(7)
Where, Laplace operator is,
 (8)
(8)
If we consider Ji = rivi(see equation 1), equation 7 is equivalent to a basic equation of hydro dynamics 22. When the substance can be absorbed (destroyed) or produced (created), equation 7 can be modified as,
 (9)
(9)
Where, ki is a constant and is sometimes called the growth factor 20, 22.
Because of the growth factor, equation 9 indicates possible sources of the virus droplets. The sources can be artificial as well as natural (persons’ respiratory systems). We believe, some artificial sources of the virus droplets are air-conditioning systems because the systems can absorb, release and transmit virus droplets.
Coronaviruses easily survive and maintain high infectious rates in dirty, wet and or cold environments, such as some meat markets 8 or plants 25. The air pollution is linked with higher COVID-19 death rates 26, 27. The dingy environments and (or) air-conditioning, freezing systems sufficiently provide such necessary dirty, wet and cold conditions and polluted airflows to exacerbate the mortality rate of COVID-19. Therefore, we strongly suggest: to use air conditioners as less as possible, turn the wind levels as low as possible and to clean (disinfecting) the air-conditioning systems (filters and channels) and environments as frequently as possible.
Constant ki in equation 9 is usually positive for virus carriers and negative for the non-infected persons or masks, meaning the virus carriers and non-infected persons or mask materials respectively produce and absorb the virus droplets.
Of course, there is a maximum absorption saturation of the mask materials. Therefore, frequent cleaning (disinfecting) or changing masks should be performed to maintain the appropriate absorption, this is very significant especially for the medical or healthcare workers who treat patients with COVID-19.
Frequent cleaning (washing) our upper respiratory tracts (nostrils, tongue, throats, mouths), hands, faces, eyes, and ears; and taking warm showers, are also very helpful to prevent or cure the diseases 3, 28.
In enclosed or confined environments, possible solutions of the equation 9 may be reverberating or oscillating waves 21, 22 of the ghost airflows (virus droplets) in space domain, and the smaller the space, the stronger the oscillation characteristics. These waves should be minimized too.
Comparisons of the Prevention Efficiencies between People Who Are Accustomed and not Accustomed to Wear Masks
We define an absolute death rate (ADR) in a region as:
ADR = Rtdap= (Total Deaths) / (Absolute Population)(10)
Where R denotes the rate; superscript td and subscript ap respectively denote total deaths and absolute population, and ADR is also mortality rate.
ADR is equivalent to a mixed representation of the death rate: covariant to the total deaths and contravariant to the absolute population, which means the less the total deaths or the more the absolute population, the lower the death rate. The lower the death rates, the higher the prevention efficiencies. See the pandemic data in Figure 6,there is a significant difference between people who are accustomed and not accustomed to wearing masks.
To associate the absolute death rate (ADR) with information theory, we consider ADR as absolute death information intensity (ADII) 29, and define absolute death information (ADI) in a region. Based on Shannon’s information theory, ADI is:
ADI = -Log2(ADR) = -Log2(Rtdap)(11)
The higher the ADI, the higher the prevention efficiencies are. See the pandemic data in Figure 7, there is a significant difference of ADI between people who are used and not used to wear masks.
Figure 6.The comparison of absolute death rates (ADR) between people who are accustomed and not accustomed to masks. ADR are from 0.0 to 0.0000073 for those who are accustomed to masks. Means and SDVs for the accustomed and not accustomed mask-wearers are 0.0000028+|-0.0000026 and 0.00074+|-0.00072 respectively; P value = 0.015. NYC means New York City, USA-NYC denotes USA excluding NYC. See the text.
Figure 7.The comparison of absolute death information (ADI) between people who are accustomed and not accustomed to masks. Means| SDVs for the accustomed and not accustomed mask-wearers are respectively 19.94|3.06 and 10.75|0.94; P value = 0.0000088. NYC means New York City, USA-NYC denotes USA excluding NYC. 0 deaths are approximated to 1 death for the log function. See the text.
Because the areal sizes between different regions vary greatly, for example, the areal size of the United States is about 14,000 times of that of Singapore 17, we define a relative death rate (RDR), to emphasize impacts of different areal sizes (km)2. RDR is:
RDR =Rtdrp = (Total Deaths)/ [(Relative Population)* (km)2] = (Total Deaths)/[(Absolute Population)* (km)2/(Areal Size)] = ADR* (Areal Index) =Rtdap* (AI)= Rtdapai (12)
Where subscript rp and superscript ai respectively denote the relative population (population density) and areal index (AI) with zero dimension,AI is,
Areal Index (AI) = [(Areal Size)(km)2]/(km)2(13)
RDR is also equivalent to a mixed representation of the death rate: covariant to the total deaths or areal index, or contravariant to the absolute population, which means the less the total deaths or the areal index, or the more the absolute population, the lower the death rate. The lower the RDR, the higher the prevention efficiencies are.
Figure 8 illustrates a comparison of RDR of the pandemic data between people who are used and not used to wear masks. We see some difference between people who are used and not used to wear masks, though P value = 0.18.
Figure 8.The comparison of relative death rates (RDR) between the accustomed and not accustomed to masks. RDR are from 2.03 (NYC) to 2690 (USA-NYC) for the not accustomed to masks and 0.000609 (Hong Kong) to 31.9 (China Mainland) for the accustomed to masks. Means and SDVs for the accustomed and not accustomed mask-wearers are respectively 4.10+|10.5 and 423+|-857; P value = 0.181. NYC means New York City, USA-NYC denotes USA excluding NYC. See the text.
To associate the relative death rate (RDR) with information theory, we consider RDR as a relative death information intensity (RDII) 29, and we define a relative death information (RDI) in a region. Based on Shannon’s information theory, RDI is:
RDI = -Log2RDR = -Log2[Rtdrp] = -Log2[Rtdapai] (14)
The higher the RDI, the higher the preventing efficiencies are. See the pandemic data in Figure 9, there is a significant difference of RDI between people who are used and not used to wear masks.
Figure 9.The comparison of relative death information (RDI) between the accustomed and not accustomed to masks. Means|SDVs for the accustomed and not accustomed to masks are respectively 3.24|5.37 and -6.61|2.99; P value = 0.00038. NYC means New York City, USA-NYC denotes USA excluding NYC. 0 deaths are approximated to 1 death for the log function. See the text.
The current pandemic data are highly correlated to the effects of mask-wearing: since the beginning of the pandemic outbreak, (1) people who are accustomed to wear masks have been wearing masks at high percentages and they have high prevention efficiencies; (2) people who are not accustomed to wearing masks have been wearing masks at low percentages and they have low prevention efficiencies. Therefore, the current pandemic data support our models in this study.
In similar ways as equations 10 - 14, we also define an absolute infection rate (AIR), i.e., absolute infection information intensity (AIII)29, in a region as,
AIR = Rtccap= (Total Confirmed Cases) / (Absolute Population) (15)
and absolute infection information (AII) as:
AII = -Log2(AIR) = -Log2(Rtccap)(16)
and a relative infection rate (RIR),i.e., a relative infection information intensity (RIII) 29 in a region,
RIR = Rtccrp= Rtccap* AI = Rtccapai (17)
and relative infection information (RII) as:
RII = -Log2RIR = -Log2(Rtccrp) = -Log2[Rtccapai](18)
to compare prevention efficiencies of infectious diseases for people in different regions.
Due to the different standards countries or regions have in measuring infectious cases, we have listed these equations here as they are important but we have not found an appropriate method to make direct comparisons.
Discussions
So far, during the COVID-19 pandemic, the rates of fatalities and (or) mortalities of people who are accustomed to wearing masks are roughly the same as that of influenzas infectious diseases; in contrast, the rates of people who are not used to wearing masks are ten to hundred folds of that of the people who are used to wear masks 1, 2, 8, see Figure 6 to Figure 7, Figure 8, Figure 9.
Comparing the death rate of Sweden (without lockdowns and nor mask-wearing) and that of Republic of (S) Korea, Taiwan and Japan (without economic lockdown and with mask-wearing) 1, we think we can avoid the lockdowns (shutdowns) in future epidemics or pandemics, as long as we follow WHO or CDC guidelines of the precautionary measures (mask-wearing is the first important).
The face masks (covers) don't have to be N95 for medical or healthcare workers; they can be general medical masks or homemade cloth masks (covers) 12, 13 as long as long they are hygienic and can filter out ghost airflows or virus droplets. The more people wear masks in daily life, the less the N95 masks are needed for healthcare workers in clinics. Of course, infants under 2 years old should not use any mask or cover 1, 2.
We believe the following measures could be very helpful to cure or to prevent COVID-19: to drink more warm liquids with complete nutrients 3, 29, 30, 31, 32 and water for easy digestion, energy supplementation, and blood clots prevention 33. This is a similar solution to altitude sickness during hypoxia: drinking more nutrients and water than usual when we have no appetite to eat; to sip distilled liquors, 60%-70% by volume, 1 cc or ml/an hour (for adults only), according to our previous initial clinical trials of treating flu infection before 29, 30.
In similar ways to equations 10 - 14, we could define an absolute natural herd immunity rate (ANHIR), i.e., absolute natural herd immunity information intensity 29 (ANHI II), in a region. ANHIR is,
ANHIR =AIR – ADR = Rtccap - Rtdap= Rtcc-tdap(19)
and an absolute natural herd immunity information (ANHII) :
ANHII= -Log2 (ANHIR)= -Log2(Rtcc-tdap) (20)
and a relative natural herd immunity rate (RNHIR), i.e., a relative natural herd immunity information intensity (RNHIII) 29, in a region. RNHIR is,
RNHIR = RIR – RDR = Rtccrp - Rtdrp = Rtcc-tdrp = Rtcc-tdap* AI =Rtcc-tdapai(21)
and a relative natural herd immunity information (RNHII):
RNHII= -Log2(RNHIR) = -Log2(Rtcc-tdrp) = -Log2(Rtcc-tdapai)(22)
Based on equations 19- 22, high natural herd immunity rates could be achieved by the high infection rates and low death rates generally, such as the immunity data of Singapore 1.
The mask-wearing or maintaining social distancing might play a role to minimize the rate of infection mortality and to maximize the natural herd immunity; with measures of mask-wearing and other precautions, we would significantly reduce the losses of our lives and economies in the battles against COVID-19. It is possible, that most of the mildly symptomatic individuals have achieved the natural herd immunization, regardless of whether or not they have been detected using a virus test kit.
Just like current security examinations, we predict, in future, that virus tests will be routine to prevent the spread of infectious diseases for some public activities such as traveling, entertainment, banquets, sports, assemblies or meetings as well as working, because the it is uncertain when the respiratory infectious diseases break out.
Therefore, we suggest all people routinely carry face masks (covers) with them when they are outdoors or in public environments, and wear masks when necessary, in similar ways to how healthcare workers wear masks in hospitals or as how we would wear a hat or scarf. We should use proven precautionary measures to respond to the unpredictability of viruses for future prevention of infectious epidemics or pandemics.
Conclusions
It is much easier to defeat reduced amounts of virus (12.5%, 25% or 50%) than to overcome all 100% of the virus.
The both measures of mask-wearing and maintaining social distancing can prevent COVID-19. However, the mask-wearing is more efficient and practical than the maintaining social distancing in crowded and (or) enclosed (confined) environments, because of limited spaces or ghost airflows.
You can protect not only yourself but also others with mask-wearing, especially in crowded or confined environments. The current COVID-19 pandemic data support our models.
For the comparisons, we proposed new equations based off of existing information theory, basic science, physics, and mathematics: areal index; absolute and relative rates of the death, infection and natural herd immunity and the related information (intensities), contravariant, covariant and mixed variant representations.
We also predict: in the future, most people will carry or wear face masks (covers) in their daily life; the virus tests will become routine tests to prevent infectious diseases, similar to current security examinations for public activities; we will use our proven measures (precautions) to respond to the unpredictability of viruses to prevent the epidemics or pandemics.
We believe we can successfully reopen all systems after lockdowns, and (or) avoid the future lockdowns (shutdowns) as long as we follow all of the prevention guidelines: including mask-wearing, maintaining social distancing, hand washing, and frequent cleaning of artificial (such as air-conditioning systems) as well as natural (such as persons’ respiratory airways) sources of ghost airflows.
References
- 3.Cheng K, Cheng V, Zou C. (2020) Urgent prevention of coronavirus disease 2019 (COVID-19): Chinese eating and mask-wearing cultures. , Journal of Public Health International 2(2), 8-14.
- 4.Chan J F, Yuan S, Kok K, To K, Chu H. (2020) A familial cluster of pneumonia associated with the 2019 novel coronavirus indicating person-to-person transmission: A study of a family cluster. doi: 10.1016/S0140-6736(20)30154-9. , Lancet 395(10223), 514-523.
- 5.Anzai A, Kobayashi T, Linton N M, Kinoshita R, Hayashi K. (2020) Assessing the impact of reduced travel on exportation dynamics of novel coronavirus infection (COVID-19) doi: 10.3390/jcm9020601. , J. Clin. Med 9, 601.
- 6.Zhu N, Zhang D, Wang W, Li X, Yang B. (2019) A novel coronavirus from patients with pneumonia in China. doi: 10.1056/NEJMoa2001017. , N Engl J Med 382(8), 727-733.
- 7.CDC Coronavirus.Disease 2019 (COVID-19) Recommendation Regarding the Use of Cloth Face Coverings, Especially in Areas of Signi_cant Community-Based Transmission.
- 10.Rockwood C A, O'donoghue D H. (1960) The surgical mask: Its development, usage, and efficiency A review of the literature, and new experimental studies. doi: 10.1001/archsurg.1960.01290230081010.AMA Arch Surg. 80(6), 963-971.
- 11.Leung H. (2020) Why wearing a face mask is encouraged in Asia, but shunned in the U.S. Hong Kong,Times Health COVID-19.
- 12.Davies A, Thompson K A, Giri K, Kafatos G, Walker J et al. (2013) Testing the efficacy of homemade masks: Would they protect in an influenza pandemic? Disaster Med Public Health Preparedness. 7, 413-418.
- 13.Amy L. (2020) Baxter, Is it time that we all start wearing masks? Commentary, Medscape Public Health,https://www.medscape.com/viewarticle/927890_print.
- 14.Gralton J, Tovey E, McLaws M L, Rawlinson W D. (2011) The role of particle size in aerosolised pathogen transmission: A review. , Journal of Infection 621-13.
- 15.Dobkin J, Diaz C, Gottehrer-Cohen Z. (2020) Coronavirus Statistics: Tracking The Epidemic In New York. The Gothamist/WNYC newsroom, May ?.
- 17.James F Shanahan, Kim J. (2020) Davis. The production supervisor was. HARRISON’S Infectious Diseases2010by The McGraw-Hill Companies .
- 18.Nelson D L, Cox M M. (2008) . Lehninger principles of biochemistry, 5th Ed. New York:W.H.Freeman And Company .
- 19.Goldberg B B, Kolter M N, Ziskin M C, Waxham R D. (1975) . , New York, USA, Diagnostic Uses of Ultrasound, Grune & Stratton
- 22.Sokolnikoff I S, Redheffer R M. (1996) . , Mathematics of Physics and Modern Engineering, McGraw Hill,New ork,NY,USA
- 23.Cheng K, Cheng V, Zou C. (2018) Modeling working mechanisms of human cochlea. https://www.webmedcentral.com/wmcpdf/Article_WMC005480.pdf information intensity , WebmedCentral Otorhinolaryngology 9(6), 005480.
- 24.Coronavirus Resource Center. As coronavirus spreads, many questions and some answers Updated:June5,2020.Harvard Health Publishing,Harvard Medical School.
- 25.Rice C W, Schoen R, Aristidou A, Burgess S C, Capalbo S et al. (2020) Keeping up with the fast-moving world of crisis management. Agric Human Values.2020May18. 1-3.
- 26. (2020) School of Public Health. Air pollution linked with higher COVID-19 death rates.HarvardT.H.Chan.
- 27.Gerretsen Isabelle. (2020) There’s a murky relationship between air pollution and coronavirus, which may mean that tackling air pollution will be a crucial part of easing lockdown. Future Planet, BBC .com 27thApril2020. https://www.bbc.com/future/article/20200427-how-air-pollution-exacerbates-covid-19
- 28.Cheng K. (2019) Prevention or treatment of human ear pain, itch or vertigo (dizziness) caused by cerumen (earwax) impaction and ear hairs. , Open Science Journal of Clinical Medicine 7(2), 52-55.
- 29.Cheng K. (2012) Biomedical Infophysics. CreateSpace Independent Publishing Platform(April19,2012),USA.
- 30.Cheng K. (2009) Distilled liquors (60%-70% by volume) could cure sore throats caused by influenza.UPublisher.info.
- 31.Cheng K. (2020) Health Oriented Lifelong Nutrition Controls: Pre-venting Cardiovascular Diseases Caused by Obesity. , SM J Nutr Metab 6, 5.
Cited by (1)
- 1.Guo L., Yang Z., Zhang L., Wang S., Bai T., et al, 2021, Systematic review of the effects of environmental factors on virus inactivation: implications for coronavirus disease 2019, International Journal of Environmental Science and Technology, 18(9), 2865, 10.1007/s13762-021-03495-9