
Abstract
In biomedical research the use of mammalian tissues is crucial to increase our understanding of complex human diseases. Mass spectrometry-based proteomic approach has become the most powerful tool of studying large-scale protein expression profiles in mammalian tissues. To perform global proteome analysis quantification of mammalian tissues, we generated 15N SILAC mice to obtain tissue-matched labeled peptide libraries for mass spectrometry-based quantitative proteomic analysis. We developed a new labeling protocol to circumvent adverse effects of introducing 15N labeled diet to mice, and showed that the new labeling scheme has no significant effect on the fertility and reproduction of C57/BL6 mice. Using labeled tissues from these mice, we compared the reproducibility of mass spectrometry-based quantification with or without 15N labeled internal standards among biological replicates of young and old brains. We found that labeled-based quantification is less susceptible to variations from instrument conditions and produces more consistent quantifications among biological replicates than label-free quantification. Lastly, we showed that over 60% of peptides from the human brain are quantifiable with internal standards from 15N labeled mouse brain and therefore present a promising alternative of quantifying human tissues that do not have existing cell lines available for SILAC labeling.
Author Contributions
Academic Editor: Leonid Tarassishin, Associate; Department of Pathology; Albert Einstein College of Medicine
Checked for plagiarism: Yes
Review by: Single-blind
Copyright © 2013 Antonius Koller, et al
 This is an open-access article distributed under the terms of the Creative Commons Attribution License, which permits unrestricted use, distribution, and reproduction in any medium, provided the original author and source are credited.
Competing interests
The authors have declared that no competing interests exist.
Citation:
Introduction
Liquid chromatography (LC) coupled to electrospray mass spectrometry (MS) is well established in shotgun proteomics to rapidly identify and quantify large numbers of proteins. Quantification of identified proteins from different samples in LC-MS/MS is performed using certain physical attributes of peptides as surrogate measurements. One approach to perform global quantitative proteome comparisons by LC-MS/MS is to include a labeled version of peptides in the samples. Stable-isotope labeled amino acids or isobaric chemical mass tags can be introduced to cells through the growth media (SILAC)1, 2, 3 or covalently linked to proteolyzed peptides (ICAT, iTRAQ, or TMT)4, 5, 6, 7, 8, 9 respectively to generate internal standards for LC-MS/MS based quantification. Alternatively, label-free LC-MS/MS based protein quantification can be achieved by measuring mass spectral peak intensities of peptide ions or the total number of spectra identified for a protein (spectral counting)10, 11, 12.
Although label-based protein quantification methods are superior for quantifying biological relevant changes, label-free protein quantification methods have been widely adapted in many laboratories due to lower starting costs and improved bioinformatics software for peptide peak quantification13, 14, 15, 16, 17, 18, 19. With the recent advances in mass spectrometers and informatics, high-resolution LC-MS/MS technology has become the most powerful tool to identify and quantify thousands of proteins from complex tissues. However, unlike cells in culture, mammalian tissues consist of heterogeneous cell types and are known to exhibit more variations than tissue culture cells. Proteomic analyses of biological replicates provide a handle on experimental variation and allow statistical analyses to be used to identify differences of protein expression levels in samples. The more replicates, the more robust the statistics, but analyzing replicates is expensive and time consuming, and often it is difficult to generate sufficient starting material for evaluating biological and technical replications. In this scenario, quantification methods that are less susceptible to the sampling bias produced by the mass spectrometer will allow us to differentiate true biological differences from small differences inherent amongst biological replicates. In this paper, we report that quantitative analysis using tissue-matched internal standards from 15N SILAC mice identified more proteins that are significantly altered between the young and old brain tissues from 3 biological replicates than quantitative analysis of the same tissues using the spectral counting method. To extend the utility of these labeled reference proteins, we examined the possibility of quantifying human proteins using labeled mouse proteins from 15N SILAC mice. As a result we found that a large amount of peptides from the human brain could be quantified when combined with analysis of labeled peptides from 15N SILAC mouse brain.
Materials and Methods
Chemicals and Biologicals
InvitrosolTM was purchased from Invitrogen (Carlsbad, CA). Trypsin (modified, sequencing grade) was obtained from Promega, WI. Other laboratory reagents were purchased from Sigma-Aldrich (St. Louis, MO) and Thermo Fisher Scientific (Waltham, MA) unless noted otherwise. 15N-enriched Spirulina was purchased from Cambridge Isotope Laboratories (Andover, MA). 15N-enriched Ralstonia was purchased from Silantes GmbH (Germany). All C57/BL mice were obtained from in-house breeding colony. The protein-free mouse diet was purchased from Harlan Laboratories Inc. (Indianapolis, IN). Human brain tissue was purchased from BioChain Institute Inc. (Newark, CA) and homogenized using the same protocol as the 15N SILAC labeled tissues.
Preparation of 15N-enriched Diet
10 grams of Spirulina biomass or Ralstonia were mixed with 30g protein-free diet powder (Harlan TD08152) and H2O to make food pellets as described previously20.
Metabolic Labeling with 15N-enriched Diet
Protocol 1 without adaptation. 6-8 weeks old sexually mature C57/BL female mice were immediately placed on 14N-unlabeled diet (Spirulina or Ralstonia) for 1 week (acclimation) and then mated with C57/BL male mice. Pregnant female mice were continued in the study and fed strictly 15N-enriched diet throughout the pregnancy and nursing. The weight and size of pups were recorded from day 7 (p7) to day 16 (p16).
Protocol 2 with adaptation. 6-8 weeks old sexually mature C57/BL female mice were fed with a mixed diet starting from 70:30 mix of normal chow and 15N-enriched Ralstonia, then 40:60 mix of normal chow and 15N-enriched Ralstonia, then 10:90 mix of normal chow and 15N-enriched Ralstonia, and finally 100% 15N-enriched Ralstonia. The weights of female mice on the adaptation diet were monitored closely to ensure no significant weight loss during each stage of diet adaptation before moving on to the next stage of adaptation. Adapted females were then maintained on the 100% 15N-enriched Ralstonia diet for mating, pregnancy, and nursing pups.
All methods involving animals were approved by the Institutional Animal Research Committee and were accredited by the American Association for Accreditation of Laboratory Animal Care.
Sample Preparation for Proteomic Analysis
Animal tissues were harvested, snap frozen in liquid nitrogen, and stored at -80oC. 0.5mg of tissue was homogenized in mass spectrometry-compatible lysis buffer (50mM Ammonium Bicarbonate, 4M Urea, 1X invitrosol, protease inhibitors, and phosphatase inhibitors) Protease and phosphatase inhibitors were obtained from Roche Applied Science (Indianapolis, IN). Protein concentration was determined using an EZQ protein assay (Invitrogen, CA). 30µg of protein lysates from the young and old mouse brains were diluted 1:1 in 50mM Ammonium Bicarbonate for trypsin digestion. Trypsin was added to each sample at a ratio of 1:30 enzyme/protein along with 2 mM CaCl2 and incubated for 16 hours at 37oC. Following digestion, all reactions were acidified with 90% formic acid (2% final) to stop proteolysis. Then, samples were centrifuged for 30 minutes at 14,000 rpm to remove insoluble material. The soluble peptide mixtures were collected for LC-MS/MS analysis.
Multidimensional Chromatography and Tandem Mass Spectrometry
Peptide mixtures were pressure-loadedonto a 250 µm inner diameter (i.d.) fused-silica capillary packed first with 3 cm of 3 µm strong cation exchange material (Partisphere SCX, Whatman), followed by 5 µm of 10 mm C18 reverse phase (RP) particles (Aqua, Phenomenex, CA). Loaded and washed microcapillaries were connected via a 2 µm filtered union (UpChurch Scientific) to a 100 µm i.d. column, which had been pulled to a 5 mm i.d. tip using a P-2000 CO2 laser puller (Sutter Instruments), then packed with 13 cm of 5 µm C18 reverse phase (RP) particles (Aqua, Phenomenex, CA) and equilibrated in 2% acetonitrile, 0.1 % formic acid (Buffer A). This split-column was then installed in-line with a NanoLC Eskigent HPLC pump. The flow rate of channel 2 was set at 300 nl/min for the organic gradient. The flow rate of channel 1 was set to 0.5µl/min for the salt pulse. Fully automated 13-step chromatography runs were carried out. Three different elution buffers were used: 2% acetonitrile, 0.1 % formic acid (Buffer A); 98% acetonitrile, 0.1% formic acid (Buffer B); and 0.5 M ammonium acetate, 2% acetonitrile, 0.1% formic acid (Buffer C). In such sequences of chromatographic events, peptides are sequentially eluted from the SCX resin to the RP resin by increasing salt steps (increase in Buffer C concentration), followed by organic gradients (increase in Buffer B concentration). The last chromatography step consists in a high salt wash with 100% Buffer C followed by an acetonitrile gradient. The application of a 2.0 kV distal voltage electrosprayed the eluting peptides directly into a LTQ-Orbitrap XL mass spectrometer equipped with a nano-LC electrospray ionization source (ThermoFinnigan). Full MS spectra were recorded on the peptides over a 400 to 2000 m/z range by the Orbitrap, followed by five tandem mass (MS/MS) events sequentially generated by LTQ in a data-dependent manner on the first, second, third, fourth, and fifth most intense ions selected from the full MS spectrum (at 35% collision energy). Mass spectrometer scan functions and HPLC solvent gradients were controlled by the Xcalibur data system (ThermoFinnigan, San Jose, CA).
Statistical Analysis
Standard statistical methods were performed to analyze the MS data sets as described and referenced in the manuscript. Pearson Correlation Analysis and Coefficient of Variation analysis were used to survey correlations of overall protein profiles between and within groups. LIMMA was employed to assess statistical significant changes of protein expression in different samples based on linear models 21. To match human and mouse peptides, the following corrections were applied to the dataset. First, we allowed the match of identical sequences with interchangeable amino acids such as I/L and K/Q. Then, we allowed the match of peptide sequences wherein two amino acids are switched (e.g. AD and DA) whereas the rest is identical.
Results
Minimizing Adverse Effects Of 15N Metabolic Labeling in Mice Through Adaptation
The feasibility of labeling rats and mice metabolically with a diet containing 13C6 lysine or 15N labeled amino acids 20, 22, 23 has been reported. The labeled protein source provides free 15N amino acids after the animal breaks down the food, which can be used to supply de novo synthesis of proteins. Although stable isotope labeled amino acids have not been reported to cause severe toxicity, we found low fertility of female breeders and lower incorporation of 15N labeled amino acids using the commonly used acclimation procedure (acclimated to the 14N versions of both diets for 1 week) using both algae-based 15N Spirulina and bacteria-based 15N Ralstonia 24. Furthermore, pups born from the labeled females remained underweight compared to pups born from females on the regular mouse chow (Figure 1A). Consequently, lower incorporation efficiency of 15N amino acids was found in most tissues derived from these underweight pups (Figure 1B, left panel).
Figure 1A.Metabolic labeling of C57/BL mice using the adaptation scheme. (A). Growth curve of pups from day 7 after birth (p7) to day 16 (p16). Weights of pups born from females acclimated with 14N Spirulina, 14N Ralstonia, or normal chow (ave. n = 15 pups from 3 litters per group) were measured. Weights of pups born from females adapted with 15N Ralstonia (ave. n = 15 pups from 3 litters) were measured.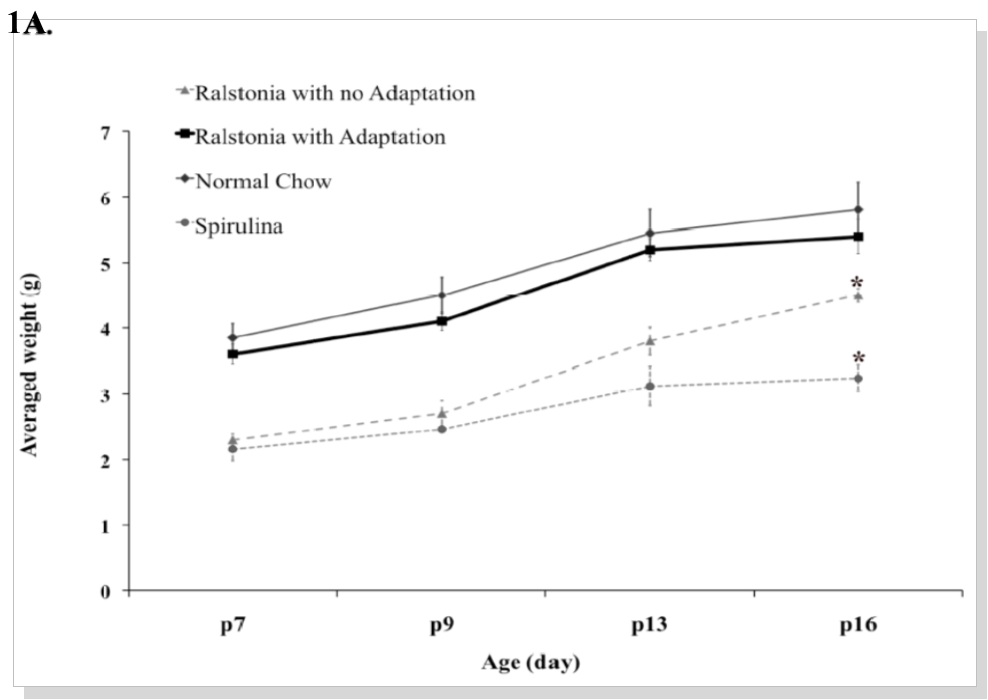
Figure 1B.Incorporation of 15N amino acids in ATP synthase beta subunit in the heart, lung, and ovary from 15N labeled mice with or without adaptation as shown by the mass spectrum of one of its peptides.
To increase the labeling efficiency of C57BL mice, we optimized the feeding protocol by gradually adapting the female breeders to the 15N labeled Ralstonia. Instead of one week acclimation with the 14N diet, however, we gradually mixed 15N-Ralstonia-based diet with the normal mouse chow and monitored the weights of these mice to determine there was no weight loss before each change in mix (30% every 1-2 weeks) as illustrated in Figure 1C. Using the new feeding protocol, we were able to normalize the weight gain of pups born from 15N-Ralstonia-adapted females (Figure 1A). Also, a significant improvement of 15N amino acid incorporation was detected in tissues derived from the newly labeled pups (Figure 1B). The global incorporation efficiency was determined by LC-MS/MS method and analyzed by SEQUEST by identifying both the light and heavy versions of peptides. Lastly, we observed no significant differences in litter sizes between 15N-Ralstonia-adapted females and unlabeled females (Figure 1D).
Figure 1C.The adaptation scheme of the new metabolic labeling.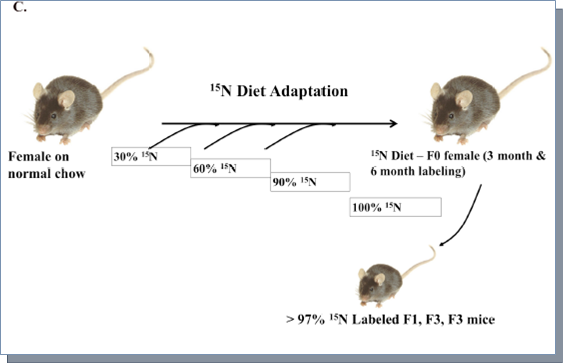
Figure 1D.Averaged litter size of 1st and 2nd generations from 15N labeled female mice using the adaptation scheme or female mice fed with the normal chow. Three litters were measured per group.
Evaluating 15N SILAC And Label-Free Quantification In Biological Replicates
To evaluate the variability of 15N SILAC And Label-Free Quantificationgenerated from biological replicates, we acquired quantitative MS data with or without tissue-matched internal standards from 15N SILAC mice from the same biological samples. Frontal cortex tissues were obtained from three young C57BL male mice (4 weeks old) and three old C57BL male mice (12 months old). Tissue lysates were generated using MS-compatible lysis buffer (see Methods) and analyzed by LC-MS/MS with or without brain lysates generated from 15N SILAC mice. The overall experimental strategy is summarized in Figure 2A.
Overall, the spectral counting (SC) method yielded 1491 proteins with at least 2 unique peptides at a 1% false discovery rate (FDR). The 15N SILAC internal tissue standard quantification method yielded 660 quantifiable proteins (at least two quantified peptides and < 20% CV among quantified peptides) at a 1% FDR. 517 proteins were identified in both dataset and used for subsequent evaluations of these two methodologies. For the SC method, normalization was performed based on the sum of unweighted spectrum counts from each MS run, and scaling factors were applied to equalize unweighted spectrum counts of all MS runs. For the 15N SILAC tissue quantification method, normalization was assessed based on 14N/15N ratios between the unlabeled to the 15N labeled standards to ensure medians are approximately 1 since 14N and 15N tissue samples are theoretically mixed at a 1:1 ratio. After normalization, distribution of log2 transformed expression values are shown in Figure 2B for both 15N SILAC tissue quantification (log2(ratio)) and SC methods (log2(SC)). The box plot in Figure 2B reveals that log2 transformed ratios are centered on zero (1:1) and log2 transformed SC have similar distributions among samples, indicating sufficient normalizations of both datasets.
Next, we performed a series of statistical analyses to study inter and intra-group variations of protein lists from these two methodologies. Using the Pearson Correlation Analysis, 15N SILAC tissue quantifications showed higher correlations within biological replicates of the same age group and lower correlations among the biological replicates between two age groups, suggesting differential protein expression patterns in the brains of old and young mice (Figure 2C). In contrast, quantitative comparisons based on the spectral counting method showed similar correlations within biological replicates and between the two age groups (uniformly > 0.9). Collectively, our data reveals that SC quantification is less sensitive in detecting subtle changes, such those that occur during aging, than 15N SILAC mouse quantification.
Figure 2.Statistical analyses of 15N SILAC labeled and label-free quantifications of mouse brain tissues at two different ages. (A). Schematic illustration of the experimental design for the comparison. (B). Quantile normalization of ratios (15N SILAC labeled) or spectra counts (label-free) quantifications of young and old brain tissue lysates. Three biological replicates were analyzed by each quantification method. (C). Pearson correlation between young and old brain tissue lysates by 15N SILAC labeled or label-free quantifications. (D). Comparisons of triplicate values (log2) from proteins commonly identified in 15N SILAC labeled and label-free quantifications. (E). Volcano plot of ratios and p-value of 15N SILAC labeled and label-free quantifications. Fold changes were derived from ratios or spectra counts of proteins from the young brain tissue lysate divided by the old brain tissue lysate. Weighed average of ratios or spectra counts were calculated to derive the log2(fold change) as shown in the x-axis. The y-axis represents the –log(adjusted p-value). Proteins fall above p< 0.05 (above 1.3 on the volcano plot) and above/below 2 fold changes (between 1 to -1 in the volcano plot) are identified as proteins with significant changes (red).
We also examined the within-group variations of these two methodologies. Log2(ratio) values (15N SILAC tissue quantification) or log2(SC) values (spectra count quantification) from three biological replicates were plotted for the final list of 517 proteins. Again, the SC approach had noticeably higher variations (average coefficients of variation = 23.1% young, 37.6% old) among biological replicates than did 15N SILAC tissue quantifications (average coefficients of variation = 9.4% young, 13.6% old) (Figure 2D). We speculated that the greater run-to-run variations of the SC approach could mask biologically relevant but subtle changes in protein expression, and therefore further interrogated the significance of both datasets using LIMMA statistics. LIMMA statistics are widely used to analyze complex experiments such as microarray and large-scale proteomic analysis, which involve comparisons among many targets simultaneously 21. The empirical Bayes moderated t test was applied to obtain estimated error rates of individual proteins in relation to other proteins in brain tissues derived from the young or old mice. Also, the Benjamini-Hochberg method was used to correct the raw p-values for multiple testing (adjusted p-values) 21. Finally, volcano plots based on adjusted p-values and fold change of protein quantification from both methods were used to demonstrate statistically significant changes associated with aging (Figure 2E). Using the criteria of greater than 2 fold changes and FDR < 0.1, 118 (17.9%) proteins were identified as significantly different between the young and old mouse brains (57 upregulated and 61 downregulated) based on the 15N SILAC mouse quantification (Table 1). Using the same criteria, only 11 (0.7%) proteins were identified as significantly different between the young and old mouse brains (9 upregulated and 2 downregulated) based on the SC quantification. Collectively, we report that the 15N SILAC mouse quantification method is superior in detecting smaller changes in expression levels given high reproducibility among replicates. However, the SC based quantification method remains useful in detecting large fold changes but with high false positive rate due to large variations among replicates.
Table 1. List of proteins identified as significantly different between the young and old mouse brains (upregulated 57 and 61 downregulated) based on the 15N SILAC mouse quantification.| Gene Symbol | logFC | t | adj.P.Val |
| Rdx | -1.00112 | -4.66125 | 9.73E-03 |
| Epb4.9 | -1.00523 | -11.0048 | 4.46E-04 |
| Camk4 | -1.01247 | -6.07443 | 3.66E-03 |
| Hagh | -1.01379 | -14.9279 | 3.95E-04 |
| Cacybp | -1.01651 | -14.8208 | 4.02E-04 |
| Ensa | -1.02568 | -9.60528 | 1.57E-03 |
| Kars | -1.02927 | -2.6089 | 7.47E-02 |
| Nrgn | -1.04089 | -4.65901 | 9.73E-03 |
| My|12b | -1.04329 | -12.4424 | 1.77E-03 |
| Dbi | -1.04735 | -6.93046 | 2.32E-03 |
| Tbca | -1.06031 | -12.551 | 1.77E-03 |
| Eno2 | -1.06342 | -14.3106 | 4.46E-04 |
| Glrx | -1.09472 | -6.9677 | 2.27E-03 |
| Tpi1 | -1.0983 | -15.1954 | 3.70E-04 |
| Thy1 | -1.10279 | -5.85519 | 4.15E-03 |
| Trove2 | -1.10975 | -13.2349 | 1.58E-03 |
| Tceal5 | -1.15909 | -6.80449 | 2.46E-03 |
| Rab3a | -1.19714 | -4.97419 | 1.18E-02 |
| Otud7b | -1.20623 | -14.3856 | 1.37E-03 |
| Spna2 | -1.21293 | -8.10623 | 1.41E-03 |
| Nudc | -1.22072 | -14.7094 | 4.10E-04 |
| Zfp207 | -1.23668 | -9.66628 | 7.71E-04 |
| Mtap4 | -1.23812 | -6.9178 | 2.33E-03 |
| Marcks | -1.23825 | -7.47919 | 1.77E-03 |
| Hba-a2 | -1.24104 | -17.9548 | 1.97E-04 |
| Tceb2 | -1.25069 | -9.16858 | 1.75E-03 |
| Ppp1r7 | -1.26468 | -17.2084 | 2.27E-04 |
| Scrn1 | -1.29738 | -3.54752 | 3.26E-02 |
| LOC10004806 | -1.30701 | -12.7304 | 1.71E-03 |
| Rpl36a | -1.31824 | -14.1384 | 4.63E-04 |
| Ncan | -1.32606 | -9.66622 | 1.55E-03 |
| Atpif | -1.4015 | -7.80101 | 2.81E-03 |
| Crip2 | -1.41013 | -11.1549 | 4.26E-04 |
| Fbx116 | -1.42927 | -5.39566 | 8.92E-03 |
| Alb | -1.43108 | -19.9068 | 1.47E-04 |
| Ptgds | -1.59602 | -10.1874 | 1.37E-03 |
| Pdhx | -1.69602 | -6.25348 | 3.32E-03 |
| Ppid | -1.71807 | -13.2183 | 6.04E-04 |
| Slk | -1.71946 | -9.521 | 1.58E-03 |
| Bat2l2 | -1.74991 | -9.54315 | 1.58E-03 |
| Tkt | -1.75714 | -23.4729 | 8.60E-05 |
| Arfip2 | -1.77083 | -4.86613 | 1.25E-02 |
| Clasp1 | -1.78128 | -2.81759 | 7.67E-02 |
| Dynll2 | -1.84366 | -8.13181 | 5.01E-03 |
| Crym | -1.87056 | -25.3731 | 6.94E-05 |
| Mdh1 | -1.96467 | -6.06443 | 5.98E-03 |
| Pebp1 | -2.00767 | -9.61289 | 1.57E-03 |
| Txn1 | -2.21917 | -8.76805 | 1.92E-03 |
| Fabp7 | -2.31867 | -8.86711 | 1.85E-03 |
| Ugcrc1 | -2.48159 | -12.9633 | 2.20E-04 |
| Nme1 | -3.3645 | -29.7247 | 5.50E-05 |
| Nme2 | -3.38895 | -22.1574 | 1.00E-04 |
| Hprt | -3.43704 | -26.792 | 6.44E-05 |
| Bat2 | -3.65165 | -26.2136 | 6.44E-05 |
| Car2 | -3.89024 | -2.70488 | 6.79E-02 |
| Lrp1 | -3.93281 | -26.3799 | 6.44E-05 |
| Manba | -3.97244 | -47.3757 | 6.44E-05 |
| Psma6 | -3.97317 | -47.3844 | 6.44E-05 |
| Pcmt1 | -4.00281 | -34.5527 | 3.62E-05 |
| LOC10004813 | -4.01773 | -47.9159 | 6.44E-05 |
| Psma2 | -4.56617 | -54.4566 | 5.50E-05 |
| Ryr2 | 6.919923 | 47.96553 | 1.51E4-05 |
| Prkce | 5.130011 | 53.43419 | 1.40E-05 |
| Maea | 4.119525 | 58.5342 | 1.38E-05 |
| Apoe | 3.294061 | 20.23446 | 5.50E-05 |
| Atcay | 3.169313 | 19.20001 | 6.44E-05 |
| Ganc | 3.069017 | 41.90215 | 2.49E-05 |
| Cops6 | 3.044587 | 39.07254 | 1.38E-OS |
| 11100141423R | 2.923171 | 38.65224 | 2.64E-05 |
| Strap | 2.76892 | 14.38835 | 1.51E-04 |
| cbr3 | 2.641309 | 21.62931 | 4.32E-05 |
| Gm6790 | 2.436359 | 24.60849 | 2.78E-05 |
| Gm10224 | 2.227471 | 36.87827 | 1.38E-05 |
| Hebp1 | 2.145326 | 30.20191 | 1.51E-05 |
| Wars | 2.07039 | 22.52939 | 3.66E-05 |
| Dstn | 1.940145 | 32.41654 | 1.40E-OS |
| Edc3 | 1.919457 | 25.64925 | 6.83E-05 |
| Gdap1/1 | 1.896176 | 16.60773 | 8.60E-05 |
| Reep5 | 1.825454 | 8.586994 | 2.08E-03 |
| Prkar1a | 1.803737 | 8.046266 | 5.16E-03 |
| Lars | 1.763578 | 26.07059 | 2.64E-05 |
| Mars | 1.701974 | 5.852546 | 4.15E-03 |
| Pfkm | 1.67197 | 17.34974 | 7.46E-05 |
| Mgea5 | 1.632783 | 8.784286 | 1.92E-03 |
| Ncdn | 1.583054 | 22.85169 | 3.62E-05 |
| Pip4k2c | 1.581312 | 19.19291 | 6.44E-05 |
| Pygb | 1.556941 | 8.618394 | 1.18E-03 |
| Dcxr | 1.526914 | 20.53489 | 1.33E-04 |
| D1OWsu52e | 1.526274 | 25.58271 | 2.64E-05 |
| Sccpdh | 1.519436 | 9.183147 | 9.50E-04 |
| Adap1 | 1.452721 | 13.443 | 1.90E-04 |
| Vdac2 | 1.420214 | 10.02884 | 1.40E-03 |
| Pan3 | 1.398228 | 11.24274 | 2.27E-03 |
| Cct7 | 1.344306 | 5.766917 | 4.40E-03 |
| Klc2 | 1.334383 | 13.53239 | 1.87E-04 |
| Atxn10 | 1.314192 | 10.60654 | 2.63E-03 |
| Fam49a | 1.303384 | 14.81966 | 1.34E-04 |
| Camk2b | 1.264573 | 2.97715 | 4.29E-02 |
| Gphn | 1.17756 | 13.78953 | 1.76E-04 |
| Ldha | 1.164437 | 2.672567 | 5.96E-02 |
| Idh3g | 1.157458 | 4.167943 | 1.48E-02 |
| Ndufa10 | 1.153564 | 10.78148 | 2.51E-03 |
| Camk2a | 1.151197 | 2.371294 | 8.35E-02 |
| Cadps2 | 1.134432 | 6.625109 | 2.73E-03 |
| 1P100625893 | 1.131261 | 10.19896 | 1.37E-03 |
| Cend1 | 1.12028 | 10.0069 | 6.60E-04 |
| Vapa | 1.112127 | 4.724606 | 9.26E-03 |
| Dnajc5 | 1.108736 | 11.79637 | 3.46E-04 |
| Pcx | 1.090174 | 17.4609 | 7.43E-05 |
| Rpl12 | 1.089912 | 9.831042 | 1.46E-03 |
| Cltc | 1.089204 | 8.725751 | 1.14E-03 |
| Vdac1 | 1.08195 | 8.19616 | 1.37E-03 |
| Sk1a2 | 1.062404 | 18.23705 | 6.44E-05 |
| Dnm1 | 1.058734 | 10.19467 | 6.04E-04 |
| Eif4a1 | 1.04E+08 | 16.73329 | 8.60E-05 |
| NPePs | 1.032538 | 10.19765 | 6.04E-CM4 |
| GIudl | 1.021206 | 8.902153 | 1.06E-03 |
| Sec3la | 1.007639 | 11.66394 | 3.62E4-04 |
Using 15N SILAC Mouse Proteins as The Global References to Quantify Human Proteins in The Brain
Finally, to extend the use of 15N SILAC mice for global proteome quantification, we studied the possibility of quantifying human tissues using tissue-matched standards from 15N SILAC mice as the availability of cell lines and concerns of recapitulating tissues with two dimensional tissue culture conditions pose significant limitations on quantitative analysis of human tissues using SILAC labeled cell lysates. As a proof of concept experiment, we spiked an equal amount of protein lysate from 15N SILAC mouse brains into tissue lysates from human brain and determined the percentage of quantifiable human peptides based on mouse peptides with identical amino acid sequences (see method). Two biological replicates were analyzed. In replicate 1, we found 2993 (60%) quantifiable human peptides from a total of 5027 human peptides identified. In replicate 2, we found 3025 (60%) quantifiable human peptides from a total of 5040 human peptides identified. Data from two technical replications were merged and analyzed for overall ratio distribution. The ratio distribution of quantifiable peptides was unimodal and >75% of peptides were within a 3-fold ratio between human and mouse proteins (Figure 3A). There was also a good agreement with ratios derived from human and mouse peptides between two technical replicates since more than 70% of proteins were within 25% CV (Figure 3B & Suppl. Table 1).
Figure 3.Overall ratios and coefficient variances of human-mouse 15N SILAC quantification. (A). 15N labeled mouse brain lysates were spiked into unlabeled human brain tissue lysates. Protein ratios derived from the human mouse paired peptides from two replications are plotted against the number of proteins (frequency) within the binned ratio. (B). Coefficient variation (CV) analysis of number of peptides within the binned CV.
Discussion
Relative quantification based on label-free approaches such as spectral counting for proteomics analysis has gained popularity since no additional chemistries or stable-isotope labeled amino acids are required. However label-free quantification suffers from poor technical reproducibility that makes it challenging for large-scale quantitative applications, especially large studies that require data acquisition over a long period of time. In addition, the resulting technical variations may not be normalized properly by adjusting the total number of acquired spectra among the MS runs. On the other hand, quantitative values obtained from quantifications including a labeled universal reference are less affected by the instrument variability and allow the MS operator to maintain platform reproducibility for large studies over a long period of time. The inclusion of stable isotope-labeled (SILAC) cell or tissue lysate as the universal reference for quantification offers a solution to this challenge. As we showed in the current studies, using 15N SILAC mouse tissues as the global reference provide more robust MS quantification among biological replicates than the label-free approach using spectral counts.
After classifying proteins identified as significantly different between the young and the old brains by their biological functions, we found enrichment of pathways that are indicative of age-related changes in brain plasticity and functional decline. For example, GNRH signaling, Melatonin signaling, protein kinase A signaling, nNOS signaling, CREB signaling, calcium signaling, and -adrenergic signaling are among the highly enriched pathways that are down regulated in the brains of aged mice (Suppl. Fig1.). One protein, protein kinase C (PKC), is found down regulated in the brains of aged mice (5 fold less) and plays a crucial role in several of these highly enriched age-regulated pathways listed above. PKC is highly expressed in neuronal tissues and has been implicated in a broad spectrum of neuronal functions 25. Many proteins related to synaptic transmission have been shown to be PKC targets. For instance, activation of PKC in neurons is frequently associated with the modulation of ion channels 26, desensitization of receptors 27, and enhancement of neurotransmitter release 28. The growth associated protein GAP-43 (F1, B50) 29, 30 and dephosphin 28 are presynaptic substrates of PKC. GAP-43 has been speculated to play a role in a wide range of neuronal functions including neurotransmitter release, neuronal development and regeneration, synaptogenesis, synaptic plasticity and memory formation, etc. Therefore, the PKC pathway may modulate the efficacy of synaptic transmission and provide a basis for memory formation. Consequently, a decrease of PKC protein in the brain may lead to reduced PKC signaling resulting in synaptic/neuronal loss as well as progressive loss of cognitive functions. In stark contrast to reports from similar proteomic studies that concluded minimal proteome changes during aging 31, our comparison identified age-dependent changes in the brain that provides a molecular basis of functional decline during aging.
Conclusions
In summary, we report that our new 15N SILAC labeling protocol worked effectively to produce mouse tissues that are highly enriched of 15N amino acids and had no significant side effects on the development of C57BL mice. Using labeled tissues from the 15N SILAC mice and unbiased statistical analyses, we saw more reliable quantitative data for the LC-MS/MS analysis allowing us to distinguish small but biologically relevant differences from mammalian tissues. With further optimization, 15N SILAC mice can provide a renewable source of labeled peptides for quantitative analysis of human proteins from tissues. Tissue lysates generated from 15N SILAC mice used in analysis can better recapitulate the molecular complexity of human tissues and therefore present a promising alternative to quantify human tissues that do not have existing cell lines available for SILAC labeling.
Acknowledgements
EC was supported by the startup funding of Stony Brook University School Of Medicine and Catalyst Award from the Susan Komen Breast Cancer Foundation. HC was supported by NIH (NS054042) and a Targeted Research Opportunity Award for Proteomics Development from the Stony Brook University Research Foundation.
References
- 1.Graumann J, N C Hubner, J B Kim, Ko K. (2008) Stable isotope labeling by amino acids in cell culture (SILAC) and proteome quantitation of mouse embryonic stem cells to a depth of 5,111 proteins. Mol Cell Proteomics. 7, 672-683.
- 2.Amanchy R, D E Kalume, Iwahori A, Zhong J, Pandey A. (2005) Phosphoproteome analysis of HeLa cells using stable isotope labeling with amino acids in cell culture (SILAC). , J Proteome Res 4, 1661-1671.
- 3.S E Ong, Blagoev B, Kratchmarova I, D B Kristensen. (2002) Stable isotope labeling by amino acids in cell culture, SILAC, as a simple and accurate approach to expression proteomics. Mol Cell Proteomics. 1, 376-386.
- 4.Wiese S, K A Reidegeld, H E Meyer, Warscheid B. (2007) Protein labeling by iTRAQ: a new tool for quantitative mass spectrometry in proteome research. Proteomics. 7, 340-350.
- 5.A M Boehm, Putz S, Altenhofer D, Sickmann A, Falk M. (2007) Precise protein quantification based on peptide quantification using iTRAQ. BMC bioinformatics. 8-214.
- 6.L R Zieske. (2006) A perspective on the use of iTRAQ reagent technology for protein complex and profiling studies. , Journal of experimental botany 57, 1501-1508.
- 7.V G Keshamouni, Michailidis G, C S Grasso, Anthwal S. (2006) Differential protein expression profiling by iTRAQ-2DLC-MS/MS of lung cancer cells undergoing epithelial-mesenchymal transition reveals a migratory/invasive phenotype. , J Proteome Res 5, 1143-1154.
- 8.Aggarwal K, L H Choe, K H Lee. (2006) Shotgun proteomics using the iTRAQ isobaric tags. Briefings in functional genomics & proteomics 5, 112-120.
- 9.DeSouza L, Diehl G, M J Rodrigues, Guo J. (2005) Search for cancer markers from endometrial tissues using differentially labeled tags iTRAQ and cICAT with multidimensional liquid chromatography and tandem mass spectrometry. , J Proteome Res 4, 377-386.
- 10.J M Asara, H R Christofk, L M Freimark, L C Cantley. (2008) A label-free quantification method by MS/MS TIC compared to SILAC and spectral counting in a proteomics screen. Proteomics. 8, 994-999.
- 11.Florens L, Carozza M J, Swanson S K, Fournier M. (2006) Analyzing chromatin remodeling complexes using shotgun proteomics and normalized spectral abundance factors. Methods. , San Diego, Calif 40, 303-311.
- 12.Liu H, R G Sadygov, J R Yates, 3rd. (2004) A model for random sampling and estimation of relative protein abundance in shotgun proteomics. Anal Chem. 76, 4193-4201.
- 13.Oberg A L, Mahoney D W. (2012) Statistical methods for quantitative mass spectrometry proteomic experiments with labeling. , BMC bioinformatics 13 Suppl 16, 7.
- 14.Huang X, Liu M, M J Nold, Tian C. (2011) Software for quantitative proteomic analysis using stable isotope labeling and data independent acquisition. Anal Chem. 83, 6971-6979.
- 15.G W Becker. (2008) Stable isotopic labeling of proteins for quantitative proteomic applications. Briefings in functional genomics & proteomics 7, 371-382.
- 16.Patel V J, Thalassinos K, Slade S E, Connolly J B. (2009) A comparison of labeling and label-free mass spectrometry-based proteomics approaches. , J Proteome Res 8, 3752-3759.
- 17.Ryu S, Gallis B, Goo Y A, Shaffer S A. (2008) Comparison of a label-free quantitative proteomic method based on peptide ion current area to the isotope coded affinity tag method. Cancer informatics. 6, 243-255.
- 18.Old W M, Meyer-Arendt K, Aveline-Wolf L, Pierce K G. (2005) Comparison of label-free methods for quantifying human proteins by shotgun proteomics. Mol Cell Proteomics. 4, 1487-1502.
- 19.Arsova B, Zauber H, Schulze W X.Precision,proteome coverage and dynamic range of Arabidopsis proteome profiling using (15)N metabolic labeling and label-free approaches. , Mol Cell Proteomics 11, 619-628.
- 20.Wu C C, MacCoss M J, Howell K E, Matthews D E, Yates J R. (2004) 3rd, Metabolic labeling of mammalian organisms with stable isotopes for quantitative proteomic analysis. , Anal Chem 76, 4951-4959.
- 21.Smyth G K. (2004) Linear models and empirical bayes methods for assessing differential expression in microarray experiments. Statistical applications in genetics and molecular biology3,Article3.
- 22.Kruger M, Moser M, Ussar S, Thievessen I. (2008) SILAC mouse for quantitative proteomics uncovers kindlin-3 as an essential factor for red blood cell function. , Cell 134, 353-364.
- 23.Zanivan S, Krueger M, Mann M. (2012) . In vivo quantitative proteomics: the SILAC mouse. Methods in molecular biology (Clifton, N.J 757 435-450.
- 24.Frank E, M S Kessler, M D Filiou, Zhang Y. (2009) Stable isotope metabolic labeling with a novel N-enriched bacteria diet for improved proteomic analyses of mouse models for psychopathologies. PLoS ONE. 4, 7821.
- 25.Tanaka C, Nishizuka Y. (1994) The protein kinase C family for neuronal signaling. Annu Rev Neurosci. 17, 551-567.
- 26.M S Shearman, Sekiguchi K, Nishizuka Y. (1989) Modulation of ion channel activity: a key function of the protein kinase C enzyme family. Pharmacological reviews. 41, 211-237.
- 27.R L Huganir, Greengard P. (1990) Regulation of neurotransmitter receptor desensitization by protein phosphorylation. Neuron. 5, 555-567.
- 28.P J Robinson. (1991) The role of protein kinase C and its neuronal substrates dephosphin, B-50, and MARCKS in neurotransmitter release. Molecular neurobiology. 5, 87-130.
- 29.Coggins P J, Zwiers H. (1991) B-50 (GAP-43): biochemistry and functional neurochemistry of a neuron-specific phosphoprotein. , Journal of neurochemistry 56, 1095-1106.
Cited by (3)
- 1.Klingener Michael, Chavali Manideep, Singh Jagdeep, McMillan Nadia, Coomes Alexandra, et al, 2014, RETRACTED: N-Cadherin Promotes Recruitment and Migration of Neural Progenitor Cells from the SVZ Neural Stem Cell Niche into Demyelinated Lesions, The Journal of Neuroscience, 34(29), 9590, 10.1523/JNEUROSCI.3699-13.2014
- 2.Tumasian Robert A., Harish Abhinav, Kundu Gautam, Yang Jen-Hao, Ubaida-Mohien Ceereena, et al, 2021, Skeletal muscle transcriptome in healthy aging, Nature Communications, 12(1), 10.1038/s41467-021-22168-2
- 3.Mori Hidetoshi, Bhat Ramray, Bruni-Cardoso Alexandre, Chen Emily I., Jorgens Danielle M., et al, 2016, New insight into the role of MMP14 in metabolic balance, PeerJ, 4(), e2142, 10.7717/peerj.2142